

Bitcoin Approaches $65K as Trump Backing Iran Deal Signals Shift
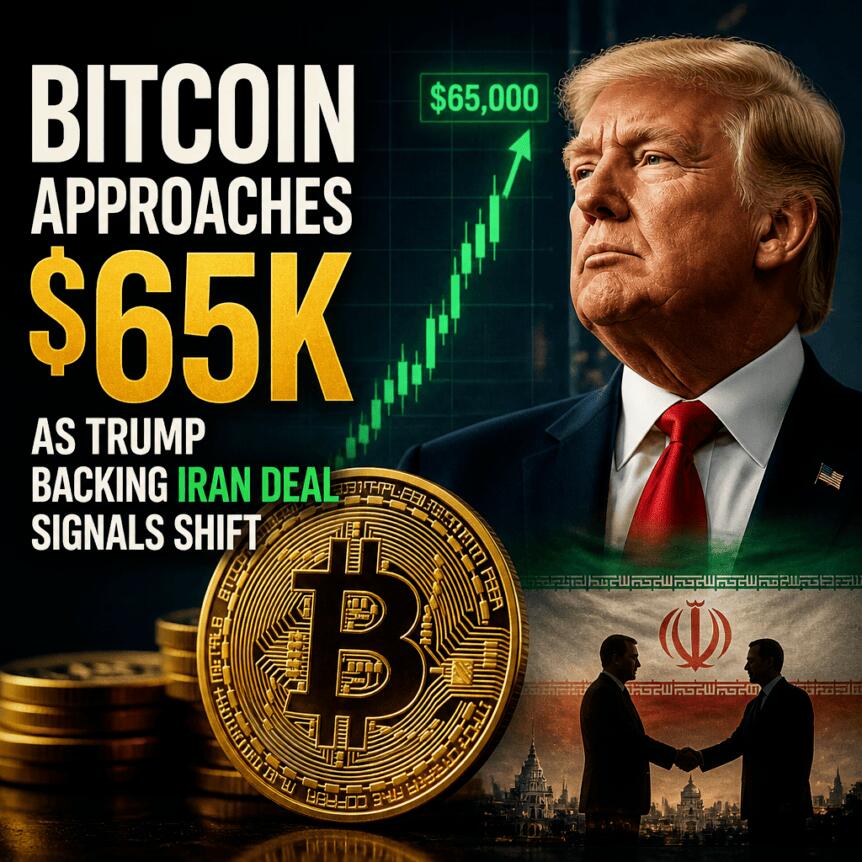
Bitcoin edged around the $64,000 mark as markets closed out the week, with momentum supported by a developing US–Iran diplomatic signal. Traders pointed to expectations that a peace deal would be signed on Sunday, alongside technical stability after a brief push to around $64,750 on Bitstamp.
While the move looks more like consolidation than a breakout, the narrative matters: in the short term, easing geopolitical risk can improve risk appetite for liquid assets such as crypto, especially when traders believe the downside case is losing traction on key chart and derivatives metrics.
Key takeaways
- Bitcoin held above $64,000 near Sunday’s weekly close after trading briefly around $64,750 on Bitstamp.
- US President Donald Trump said the Strait of Hormuz would be “open to all” immediately after a scheduled peace deal signing on Sunday.
- Traders cited the 200-week simple moving average (SMA) as a still-functioning support level, despite historical skepticism around its reliability.
- Derivatives conditions—rising open interest alongside falling funding rates, per trader analysis—were framed as a setup associated with more durable bottoms.
Geopolitics supports the tone as Bitcoin stabilizes
According to price action reviewed on TradingView, BTC settled after local highs of about $64,750 on Bitstamp. That intraday strength followed a message from US President Donald Trump, who wrote on Truth Social that the “Deal is scheduled to get signed tomorrow” and that, “immediately after it is signed,” the Hormuz Strait would be “OPEN TO ALL.”
The potential implication for markets is straightforward: the Strait of Hormuz is a critical global shipping corridor, and any sign—credible or not—of reduced disruption risk can ripple through expectations for energy prices and broader economic volatility. In crypto, that kind of macro relief often shows up first in liquid trading conditions before it reflects in longer-term positioning.
Traders watch the 65,000–67,000 zone closely
On the charts, some traders interpreted the rebound as technically constructive. In a post on X, trader SuperBro said the 200-week SMA was holding as support and described low-timeframe BTC price behavior as “constructive.”
SuperBro also argued against immediate bearish breakdown risks, pointing instead to a level linked to the point of control (nPOC) on exchange order books sitting above current spot prices. Their view framed $65,000 to $67,000 as a major “test,” anchored to the area of the last swing low and volume point of control. They added that if BTC can decisively break through that supply zone, the bearish case would weaken significantly.
Notably, earlier Cointelegraph coverage had discussed skepticism about the 200-week SMA as a “safety net,” saying its historical track record can be “unreliable” in bear markets. That creates a clear tension for investors: the same indicator that looks supportive in the present can fail to protect during prior downturn regimes. Traders appear to be treating the current holding as a useful signal—but not a guarantee.
Open interest and funding rates hint at a “bottom-style” setup
Beyond spot price levels, attention has shifted to derivatives behavior. Trader Cryptic Trades highlighted a combination of rising open interest and falling funding rates on exchanges, arguing that it may reduce the likelihood of longs getting trapped into a new downturn.
In a post on X, Cryptic Trades said, “It’s finally happening,” describing current conditions as signaling a lack of aggressive bullish chasing. Their interpretation was that the market was not behaving as if bulls were confidently adding risk at higher prices; instead, they suggested bears were “doubling down,” increasing short exposure while betting the downtrend wasn’t over.
That distinction is important because it changes how traders read the risk of a reversal. Cryptic Trades argued that when sentiment remains heavily bearish while leverage dynamics improve—specifically with falling funding rates alongside open interest rising—markets can transition from persistent downside pressure into short-squeeze territory. They described the pattern as one that “generally marks durable bottoms,” where price begins moving higher even as most participants keep leaning bearish.
Liquidation maps align with the rebound’s timing
CoinGlass liquidation heatmap data, referenced in the article, showed that the local highs coincided with a thick band of potential short liquidations. In practical terms, that means some of the price strength may have been amplified by forced exits: when price rises into areas with crowded short positions, liquidations can accelerate the move.
Even so, liquidation-driven strength can be fragile if it doesn’t transition into sustained demand. That is why traders are focusing on both nearby resistance—such as the $65,000–$67,000 test highlighted by SuperBro—and broader derivatives conditions that would signal whether the market is merely bouncing or genuinely shifting structure.
For now, investors should watch whether Bitcoin can hold gains above the key $65,000–$67,000 zone and whether funding rates continue trending lower while open interest stays elevated, as those together would support the “bottom-style” interpretation. If those conditions reverse—or if the market fails to clear the order-book and volume concentrations—then the rebound may remain constrained rather than marking a durable change.
This article was originally published as Bitcoin Approaches $65K as Trump Backing Iran Deal Signals Shift on Crypto Breaking News – your trusted source for crypto news, Bitcoin news, and blockchain updates.


Potrebbe anche piacerti

Critical USDT0 Response to Drift Hack Exposes Stark Contrast in Stablecoin Security Protocols

Crypto Hack: Drift Protocol Drained Over $200M in Private Key Breach

Bitcoin treasury sell-off accelerates as Riot, Bhutan, and public companies exit positions


Notizie di tendenza
Altro
