

SPX6900 (SPX) Climbs Into Bullish Territory: Is There More Upside to Come?
- SPX6900 is up by over 12%, hovering at $0.38.
- SPX’s volume has skyrocketed by over 1167%.
SPX6900 (SPX) was listed on South Korea’s Upbit and the second-largest exchange, Bithumb. It is currently trading at around $0.3853, after a surge of over 12.8%. If the current momentum sustains, the asset could likely break the higher crucial ranges.
Besides, the asset’s market cap is stationed at $356.08 million, and SPX’s daily trading volume has skyrocketed by over 1167%, reaching the $79.29 million mark. The lowest and highest trading levels were found between $0.3326 and $0.4018, respectively.
Zooming in on the 24-hour price chart, SPX6900’s bulls are in charge and have entered the bullish zone. The price is likely to move up toward the resistance range at $0.3924. A strong correction on the upside could trigger the emergence of the golden cross and take the price above $0.40.
On the downside, if the potent bears reappear, the SPX6900 price chart would turn red. The price might fall to the support zone at around $0.3763. Upon the bearish pressure moving deep down, the death cross could take place, and gradually send the asset’s price down to $0.36.
SPX6900’s Momentum: How Much Higher Can It Actually Go?
The Moving Average Convergence Divergence (MACD) line is above the signal line, and both are above the zero line. This indicates that the SPX market is in a confirmed bullish trend. The buying momentum is currently stronger than the selling momentum.
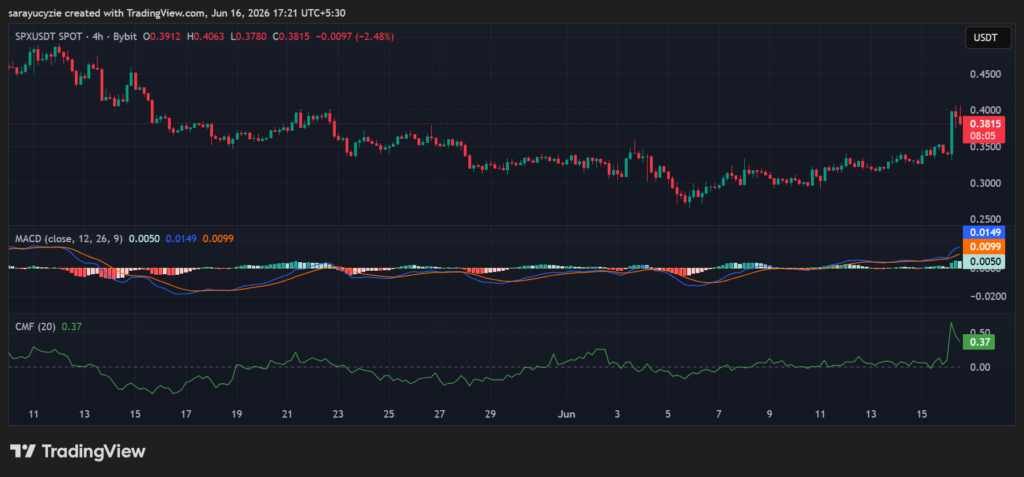 (Source: TradingView)
In addition, SPX6900’s Chaikin Money Flow (CMF) indicator reading of 0.37 points to strong buying pressure and substantial capital inflows. Also, the buyers are actively accumulating, and there is strong demand and healthy market participation.
SPX’s daily Relative Strength Index (RSI) is positioned at 66.68, suggesting strong bullish momentum, with buyers maintaining control. As it is above the neutral level, there is sustained buying strength. Traders may watch if it moves into overbought territory.
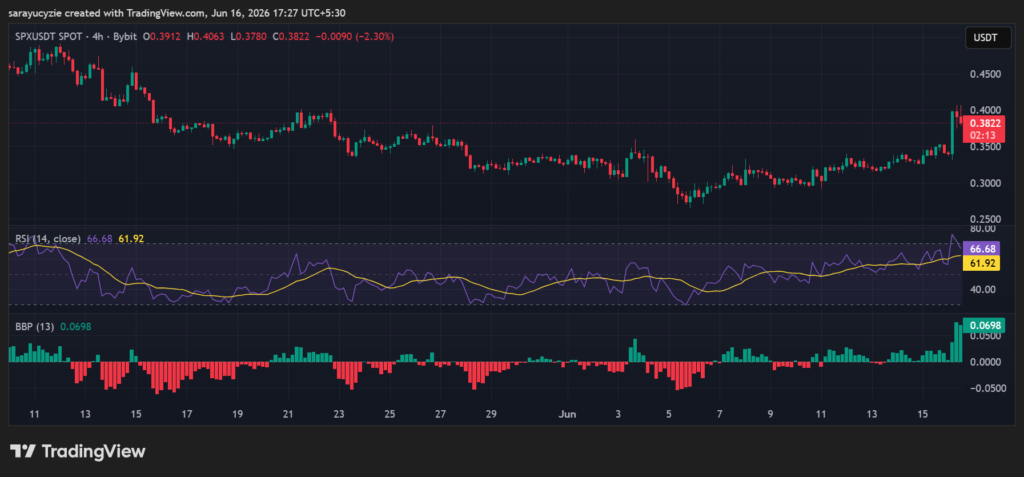 (Source: TradingView)
Furthermore, the Bull Bear Power (BBP) reading of 0.0698 showcases a modest bullish advantage. The SPX6900 price is trading slightly above its average level. However, the value is relatively low, where the bullish pressure is not particularly strong.
Crypto Market Highlights
Stellar (XLM) Lights Up the Charts With a 16% Gain: Breakout or Bull Trap?


Potrebbe anche piacerti
Cango Inc. Completes $65M Investment and Secures $10M Convertible Note Financing

Gold Price Stages Resilient Recovery, Nears $4,650 Amid Market Uncertainty

Senegal World Cup 2026: Mane’s Return, Group I Pressure and the Lions’ Knockout Path


Notizie di tendenza
Altro
