Cardano Price Drops After $540M Whale Sell-Off Halts Rally
This article was first published on The Bit Journal.
The Cardano price staged a sharp rebound in late February after flashing a bullish divergence on the daily chart. ADA jumped nearly 24% and briefly touched $0.31. Momentum indicators supported the move. Volume data confirmed active buying.
However, the rally quickly lost strength. Within days, the Cardano price dropped almost 17% from its local peak. On-chain data now shows what happened. Large holders distributed more than $540 million worth of ADA during the surge. Retail demand could not absorb that level of supply.
Cardano Price Rally Meets $540M Whale Sell-Off
The Cardano price formed a bullish RSI divergence between late December and February 24, signaling weakening bearish momentum. On February 25, ADA surged 24% and tested $0.31 before facing strong rejection.
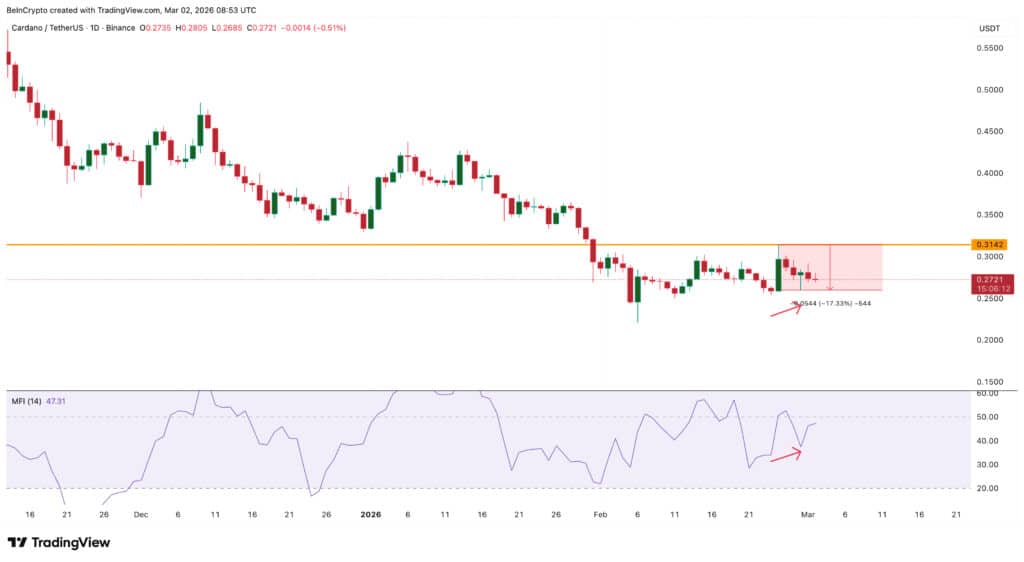
During the same period, the Money Flow Index confirmed genuine spot buying, showing that retail traders were actively accumulating. However, blockchain data revealed that whales offloaded around 2.15 billion ADA in just three days, creating roughly $540 million in sell pressure.
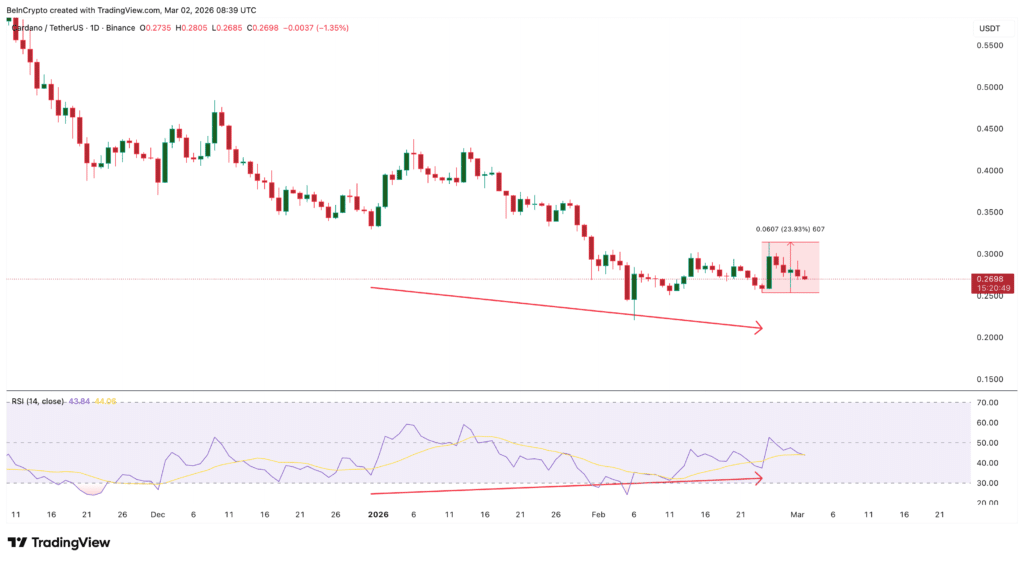 Source: TradingView
Meanwhile, futures open interest remained near yearly lows, limiting the impact of leveraged buying and reducing the market’s ability to absorb heavy distribution.
The recent Cardano price action highlights the gap between technical signals and on-chain reality. Chart indicators pointed to weakening bearish momentum. Retail traders responded to that signal and increased spot exposure.
| Month | Min. Price | Avg. Price | Max. Price | Change |
|---|---|---|---|---|
| Mar 2026 | $ 0.2759 | $ 0.3192 | $ 0.3887 |
43.74%
|
| Apr 2026 | $ 0.3729 | $ 0.4042 | $ 0.4273 |
57.99%
|
| May 2026 | $ 0.3950 | $ 0.4252 | $ 0.4446 |
64.41%
|
| Jun 2026 | $ 0.3747 | $ 0.4107 | $ 0.4451 |
64.58%
|
| Jul 2026 | $ 0.3449 | $ 0.3708 | $ 0.4096 |
51.47%
|
| Aug 2026 | $ 0.3872 | $ 0.4161 | $ 0.4344 |
60.64%
|
| Sep 2026 | $ 0.4243 | $ 0.4536 | $ 0.4931 |
82.33%
|
| Oct 2026 | $ 0.3991 | $ 0.4266 | $ 0.4492 |
66.11%
|
| Nov 2026 | $ 0.3973 | $ 0.4059 | $ 0.4152 |
53.52%
|
| Dec 2026 | $ 0.2947 | $ 0.3792 | $ 0.4195 |
55.13%
|
Yet blockchain data revealed heavy whale distribution into strength. Several large cohorts reduced holdings at the same time. The synchronized selling created intense pressure during a fragile recovery phase. As a result, the rally failed despite strong technical backing.
Bullish Divergence Sparked Optimism
Between December 31, 2025 and February 24, 2026, the price of Cardano created a lower low on the daily time frame. The Relative Strength Index registered a higher low, as well in that time. This is known as bullish divergence.
This typically happens when the price of a cryptocurrency is losing downward momentum. This does not promise a price reversal, however it absolutely enhances the chance of a price bounce.
The signal led to a powerful price movement for the coin on 25 February. Cardano grew by 24% over the course of one day. It hit a peak of $0.31, the best price level for weeks.
 Source: TradingView
Volume Indicators Confirmed Real Demand
Price momentum alone is not enough to confirm a valid move. Volume plays a crucial role. The Money Flow Index measures both price and trading volume, offering a clearer view of capital flows.
Between February 24 and February 28, both the Cardano price and the MFI moved higher together. There was no sign of bearish divergence in the indicator. Buyers were active and committed capital during the advance.
This alignment suggested that the rally was supported by genuine demand. The move was not driven by thin liquidity or artificial spikes. Retail participants were clearly buying the dip.
Rejection at $0.31 Changed the Structure
Despite strong buying pressure, the February 25 candle formed a long upper wick. This candlestick structure often indicates aggressive selling at higher levels. While buyers pushed the Cardano price toward $0.31, sellers stepped in near the highs.
The token failed to close near its intraday peak. Selling intensified in the following sessions. Within days, ADA retraced nearly 17% and returned toward the $0.27 area. The rejection level at $0.31 became a clear resistance barrier.
Whale Distribution Overwhelmed Buyers
On-chain supply data explains the sudden weakness. Between February 24 and 27, multiple whale cohorts reduced their holdings simultaneously.
The largest addresses, holding more than 1 billion ADA each, cut roughly 1.02 billion tokens in one day. The 100 million to 1 billion group initially absorbed some supply but later sold around 860 million ADA.
The 10 million to 100 million tier reduced approximately 220 million tokens. Even smaller whale addresses trimmed positions.
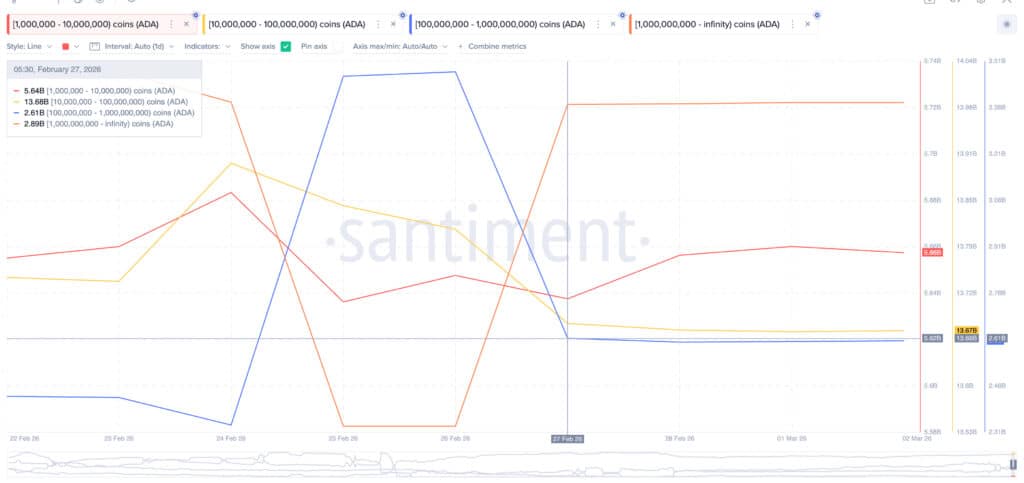 Source: Santiment
In total, about 2.15 billion ADA entered circulation within three days. At an average price near $0.27, this distribution equaled roughly $540 million in selling pressure. Retail buyers stepped in, but the scale of supply was too large to sustain upward momentum in the Cardano price.
Low Leverage Limited Follow-Through
Futures data provides additional context. In September, Cardano’s open interest reached a high of approximately $1.95 billion. By mid-February, it had dropped to less than $450 million. This was one of the weakest readings for the year.
The decline in leverage indicates that all speculative positions had been already squeezed out, prior to the divergence forming. And so the February rally was only largely fueled by spot demand, not leveraged bets.
The market didn’t have enough depth to absorb heavy selling from a whale, especially without support in the form of strong leverage or institutional inflows. The Cardano price rally fizzled out below that imbalance.
Critical Levels Now in Focus
Cardano Price Reaches $0.27 in Early March The RSI is still printing higher lows than in late December, and the divergence framework remains technically intact.
The key resistance remains $0.31. Daily closure above it, would signal a structural shift and could pave the way to $0.37. On the negative side, $0.26 serves as instant support.
Support is found at $0.23 and then $0.21, both of which are crucial levels to maintain. Should $0.21 fail, deeper Fibonacci targets at around $0.18 and $0.15 could also be on the cards.
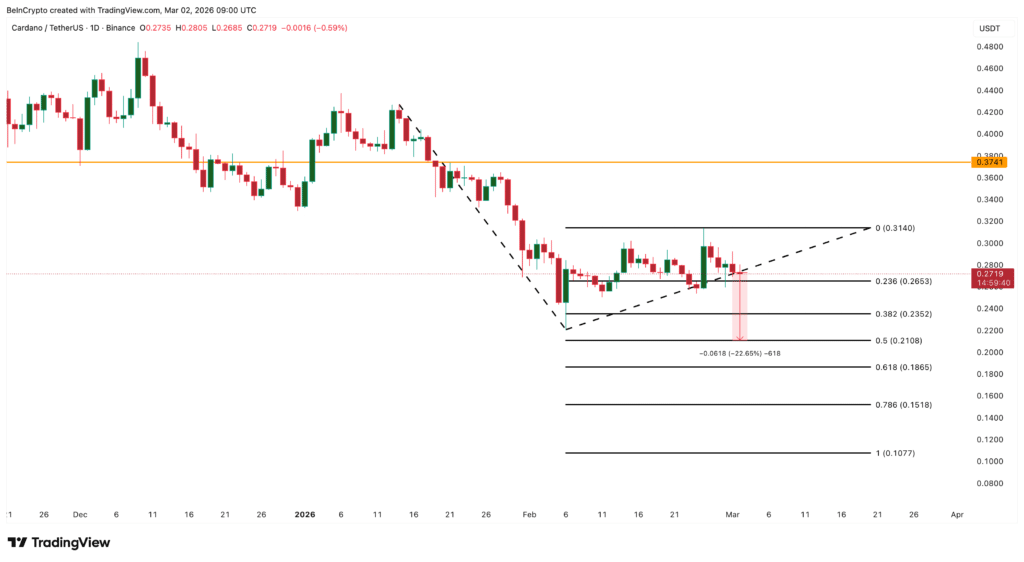 Source: TradingView
Whale Activity Will Shape the Next Move
The next move in the Cardano price may depend less on indicators and more on whale behavior. Current data shows that major holders have not resumed meaningful accumulation.
If ADA revisits lower support levels and whale cohorts begin to buy again, it would strengthen the bullish case. Accumulation at lower levels would signal renewed confidence among large holders.Until that shift appears, the market remains vulnerable to further downside pressure.
Conclusion
The late-February rally in the Cardano price demonstrates the limits of technical signals without on-chain confirmation. RSI divergence and rising MFI readings pointed to improving momentum. Retail traders responded with genuine buying interest.
However, synchronized whale distribution injected over $540 million in supply into the market. That imbalance overwhelmed demand and reversed the rally. Traders now watch both price levels and whale activity for the next decisive move.
Appendix: Glossary of Key Terms
Bullish Divergence: When the price makes lower lows and technical indicator makes higher lows.
Money Flow Index (MFI): Technical analysis tool used to measure buying and selling pressures using price and volume.
Whale: A trader who has bought a large proportion of the cryptocurrency.
On-Chain Data: A more technical range of analysis tools, monitoring whether funds are in profit or loss on the blockchain.
Open Interest: A metric to gauge outstanding derivatives contracts that remain unsatisfied.
Frequently Asked Questions About Cardano Price
1- What sparked the latest rally of Cardano’s price?
The rally, underpinned by advanced readings in the Money Flow Index column was led on by bullish RSI divergence taken from the daily.
2- What caused Cardano price drop after an uptrend of 24%?
Whales sold approximately 2.15 billion ADA during the rally, creating heavy sell pressure.
3- What is the key resistance level for ADA?
The primary resistance level is $0.31. A daily close above it could shift short-term structure.
4- Where are the major support zones?
Key supports are located at $0.26, $0.23, and $0.21.
Disclaimer:
This article is for informational purposes only and does not constitute investment advice. Digital assets are volatile, and anyone making financial decisions should conduct independent research and consider professional guidance.
References
BeInCrypto
CryptoNews
Read More: Cardano Price Drops After $540M Whale Sell-Off Halts Rally">Cardano Price Drops After $540M Whale Sell-Off Halts Rally
Potrebbe anche piacerti

Uniswap wins again in ‘scam token’ lawsuit

Will XRP Price Increase In September 2025?