Crude Oil Futures Chart: How to Read the Energy Market
If you want to trade global energy, the crude oil futures chart is your most important tool. It is not just a picture of past prices. It is a live map of human psychology, supply, and demand.
Many beginners look at a trading chart and feel confused by the green and red bars. In this guide, I will explain exactly how to read a crude oil futures chart. I will also show you how to spot macro trends and execute trades using MEXC.
The Anatomy of a Candlestick
Most professional traders use a "candlestick" chart (or K-line chart) to track oil prices. Each candlestick shows you the price action for a specific time period, like one hour or one day.
Every single candlestick gives you four critical pieces of data, known as OHLC:
Open: The price when the time period started.
High: The highest price reached during that time.
Low: The lowest price dropped to during that time.
Close: The final price when the time period ended.
If the Close is higher than the Open, the candlestick is green (Bullish). Buyers won the battle. If the Close is lower than the Open, the candlestick is red (Bearish). Sellers pushed the price down.
WTI vs. Brent on the Chart
When you open an exchange, you will see different charts for different types of oil. You must choose the right chart for your strategy.
If you are trading US economic data, you should open the WTI chart. If you are trading Middle East news, you should open the Brent chart. To understand why these two charts move slightly differently during a crisis, read our guide on the difference between WTI and Brent.
Interactive Chart Reading Simulator
The best way to understand a crude oil futures chart is to interact with one. Use the educational simulator below to see how candlesticks form. You can trigger different macro events to see how the chart reacts in real time.
Hover over the candles to read the exact Open, High, Low, and Close data.
Why 24/7 Chart Access Matters
Traditional commodity markets close on Friday evening. They do not open again until Monday morning. This creates a massive problem.
If a war starts on Saturday, the oil price will gap up massively. Traditional traders cannot see this on their charts or protect their money until Monday. By then, it is too late.
This is why modern traders use synthetic derivatives. If you want to know how this works behind the scenes, read what are crypto crude oil futures. Because crypto exchanges never sleep, your WTI and Brent charts update 24 hours a day, 7 days a week. You can see the price action the exact second a news story breaks.
Execute Your Strategy on MEXC
Once you know how to read the chart, it is time to trade. If you are ready to learn how to trade crude oil with USDT, MEXC provides the ultimate platform.
Here is why you should trade oil on MEXC:
0% Trading Fees: Every time a candlestick closes, you can enter or exit a trade without paying high broker commissions.
200x Leverage: You can use a small amount of capital to catch big profits from minor chart breakouts.
Deep Liquidity: MEXC offers institutional-grade order books. This means your market orders execute instantly, exactly where you see the price on the chart.
Do not trade blindly. Learn the chart, manage your risk, and trade the global energy market with confidence. Log in to MEXC, open the USOIL or UKOIL chart, and start catching the next big macro trend today.
人気記事
もっと見る
CPIが急上昇し、利上げ懸念が強まる中、米国債利回りが5%を突破、19年ぶりの高水準に:市場は何を織り込んでいるのか? | MEXC Alpha Trader 週間分析
2026年9月 第2週 報告期間:2026年9月9日~9月15日 データ基準日:2026年9月15日 市場概況 先週の暗号資産市場は、市場予想を上回るインフレデータ、利上げ観測の強まり、地政学的リスクの高まりという複数の下落要因が重なり、持続的な圧力を受けました。BTC は期間開始時点で$78,000付近からスタートしましたが、CPIが市場予想を上回り、米国債利回りが5%の節目を突破する中で下落基

MEXC Alpha Trader Investment Research Weekly | "US Dollar Depreciation Trade" Ignites the Market, BTC and Gold Break Through Simultaneously—A New Paradigm or a Short-Term Frenzy?
2026年8月の第3週 統計期間:2026/8/19 – 2026/8/25 データ取得時点:2026/8/25 主要な動向 直近1週間、暗号資産市場では珍しく一斉な上昇が見られました。ビットコインは週初めに約$64,000でスタートし、$65,000、$70,000、$75,000、$80,000という4つの主要な整数ラインを次々と突破しました。8月25日のアジア市場時点では、BTCは$80,9
OXYONとは?OndoによるOccidental Petroleum株式のトークン化を解説
Summary OXYON, styled by Ondo as OXYon, is a tokenized product designed to provide economic exposure linked to Occidental Petroleum Corporation (NYSE: OXY). The product chain is: Oil and Gas Markets ↓
人気暗号資産情報
もっと見る
ビットコインETFの流入が8日間の連続記録を達成:なぜBTCは80,000ドルを維持できないのか?
概要について 米国証券取引委員会に登録された規制開示と公的ファンド資産追跡によると、米国の現物ビットコイン上場投資信託は、8つの連続した取引セッションで純流入を記録し、集計機関資本で数十億ドルを吸収しました。Black Rock(IBIT)とFidelity(FBTC)をリードする資本コンジットは、引き続き堅調な純シェア創造を記録しており、登録投資顧問やファミリーオフィスからの持続的なデジタル資産

ジェネラック株が18%急急上昇!アマゾン「24億ドル」データセンター契約の真相
概要 生成AIインフラストラクチャの電力ボトルネックが本格的に発生するにつれて、ウォール街の投資の焦点は、チップコンピューティング能力から基盤となる電力供給に急速にシフトしています。バックアップ電源とマイクログリッド製造のリーダーであるGenerac Holdingsの株式は、ニューヨーク証券取引所で1日で18%以上急騰し、日中の取引量は1日の平均の3倍以上に拡大しました。この評価の再構築を推進す

SECのトークン化株式免除とは?「5年ルール」がRobinhoodとCoinbaseに与える影響
概要 世界の金融市場のインフラストラクチャは、数十年で最も深刻な制度的解体と技術的再編成を経験しています。米国証券取引委員会がデジタル資産証券およびブロックチェーン清算ネットワークのための5年間の条件付き免除フレームワークを導入したことで、米国の資本市場は、24時間年中無休のプログラム可能な株式取引への規制移行を正式に開始しました。この制度的取り決めにより、適格なブローカーおよびオルタナティブトレ

トレンドニュース
もっと見る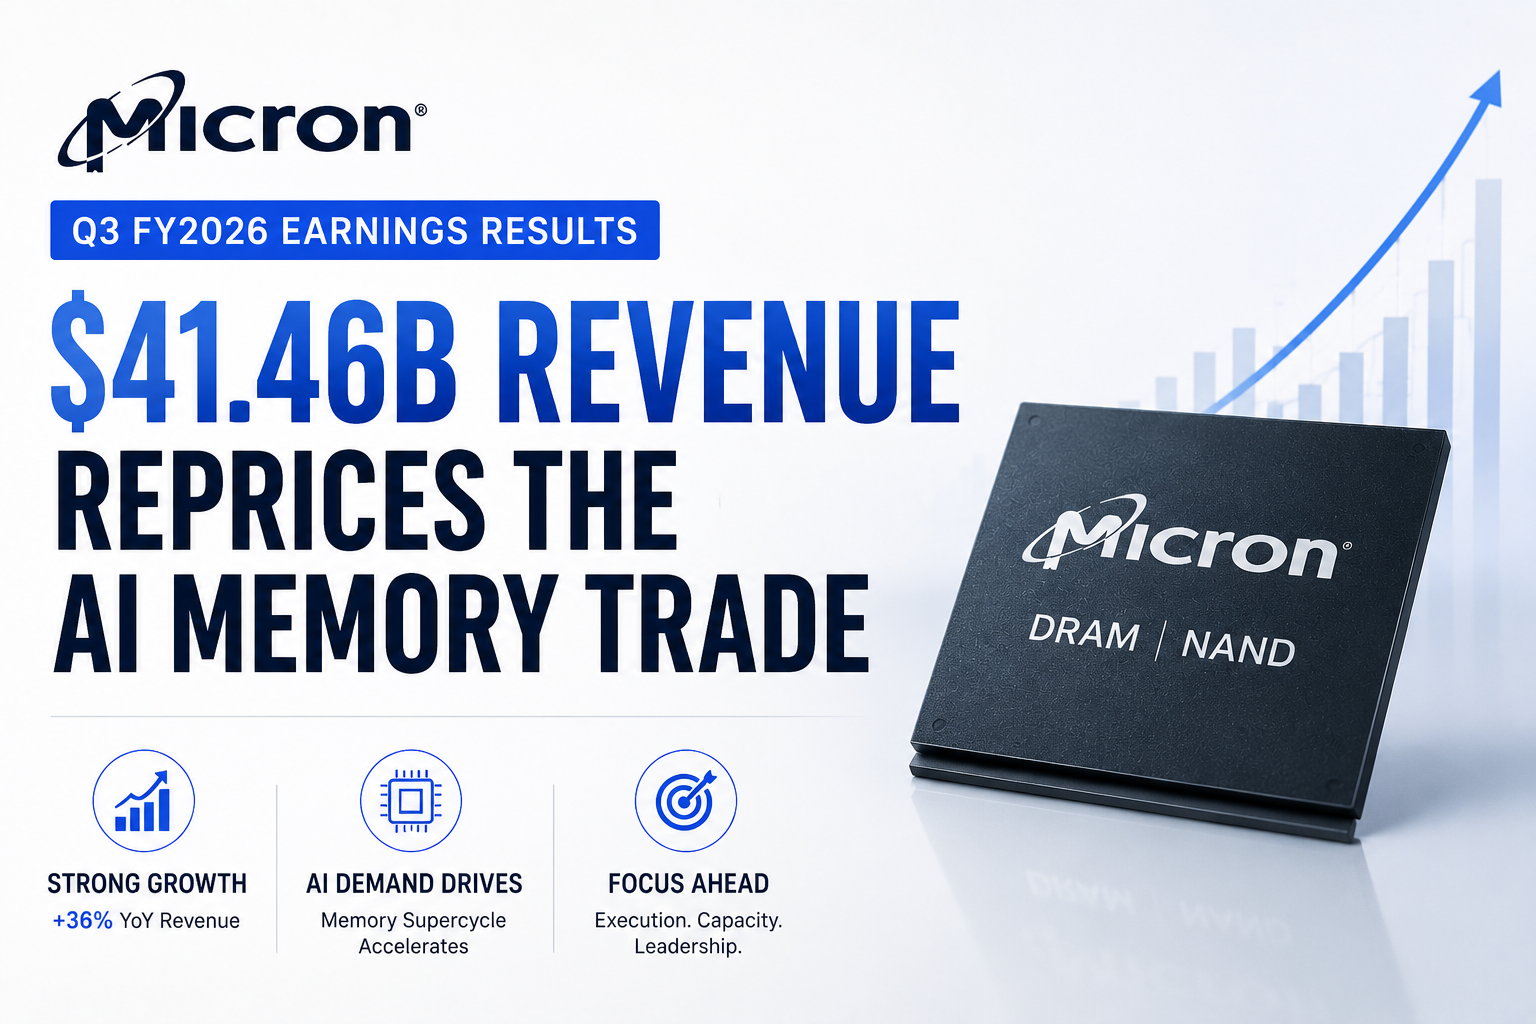
マイクロン2026年第3四半期決算:414億6000万ドルの収益がAIメモリ取引を再評価
マイクロン・テクノロジーは、AI関連のメモリやストレージの需要が供給を上回り続けたため、2026年第3四半期の収益が前年同期の93億ドルから414億6000万ドルへと大幅に増加し、記録的な決算を発表しました。非GAAPベースの希薄化後1株当たり利益(EPS)は25.11ドルに上昇し、非GAAPベースの売上高総利益率は84.9%に拡大しました。また、同社は第4四半期の収益を約500億ドル(±10億ド
NVIDIA 2026年年次株主総会:ジェンスン・フアンの「AIファクトリー」テーゼが直面する次の市場の試練
NVIDIAは太平洋時間2026年6月24日午前9時、2026年年次株主総会をオンラインで開催しました。正式な議題には、取締役の選任、役員報酬に関する勧告的承認、監査人の承認、およびいくつかの株主提案が含まれていました。しかし、市場にとって、この会議は単なる年次のガバナンス以上の意味を持っていました。それは、記録的な収益成長の年を経たNVIDIAが、AIインフラストラクチャにおける優位性を引き続き

関連記事
もっと見る
WTI原油価格、81ドルを2%下回る:トレーダーが注目すべきポイント
WTI 原油価格は日中2%下落し、1バレルあたり81ドルを割り込みました。OIL(WTI) は中東リスク、在庫関連のニュース、そしてマクロ見通しの見直しによって引き起こされた変動局面を経て、再び下落圧力を受けています。この動きは単なる日中の調整ではありません。供給逼迫リスクと需要鈍化という2つの対照的なシナリオの間で、原油トレーダーがどれほど迅速にポジションを切り替えているかを示しています。重要な

AMZN株価、決算後に急騰:アマゾン社のAI投資、ついに実を結んでいるか?
Amazonの2026年第2四半期決算後、AMZN株は急騰しました。投資家は、AWSの成長加速、小売事業の執行力強化、広告収入の増加、そして大幅に拡大したAI投資計画に対して反応しました。AMZNUSDT を注視するトレーダーにとって、重要な問いはもはや「AmazonがAIに積極的な投資を行っているかどうか」ではありません。その点は明らかです。真の問いは、その投資がコストを正当化する十分な成長をも

AIテックセクターは弱気相場に入っているのでしょうか?
AI技術セクターには本格的な圧力がかかっています。半導体株は今年最も急激な調整の一つを経験し、ナスダック100も修正ゾーンに近づき、トレーダーたちは NVDAUSDT と SOXLUSDT を押し上げたAI取引がとうとう行き過ぎたのではないかと疑問を抱いています。明確な答えはこうです:AI取引の一部はすでに弱気相場に入っていますが、より広範なAI技術サイクルはまだ明確に崩れていません。この区別は重