Solana price confirms bearish crossover following Drift exploit, will it crash?
Solana price fell nearly 9% following a major exploit on its Drift Protocol DeFi platform that drained nearly $300 million in digital assets.
- Solana price dropped about 9% after a $285 million exploit on Drift Protocol, one of the largest hacks in the network’s history.
- Broader market weakness tied to escalating U.S.–Iran tensions and rising oil prices added to selling pressure on SOL.
- Technical indicators signal continued downside risk, with key support at $75, while a move above $93 could invalidate the bearish setup.
According to data from crypto.news, Solana (SOL) price fell 9% to an intraday low of $78.6 on April 2, bringing its market cap down to $45.5 billion. Over the past 7 days, SOL price has fallen by over 10%, marking the steepest loss among the top 10 cryptocurrencies in the market.
Solana price crashed following a major exploit on the Drift Protocol that left investors concerned about the security of decentralized finance applications on the network. Notably, the $285 million hack stands as one of the largest hacks in the Solana ecosystem over the past 5 years.
The token also fell along with a broader market drop as investors retreated to the sidelines on news of an escalation of the U.S. and Iran conflict in the Middle East, which has led oil prices to climb back above $100.
Solana price has also suffered due to lackluster demand from institutional investors. Data from SoSoValue show that spot Solana ETFs have recorded no inflows over the past nine days aside from the $4.64 million inflow seen last Thursday.
Solana price analysis
On the daily chart, Solana price has followed a descending channel pattern that it has respected since mid March. Cryptocurrencies tend to form lower lows and lower highs within this range as long as they remain under bearish pressure.
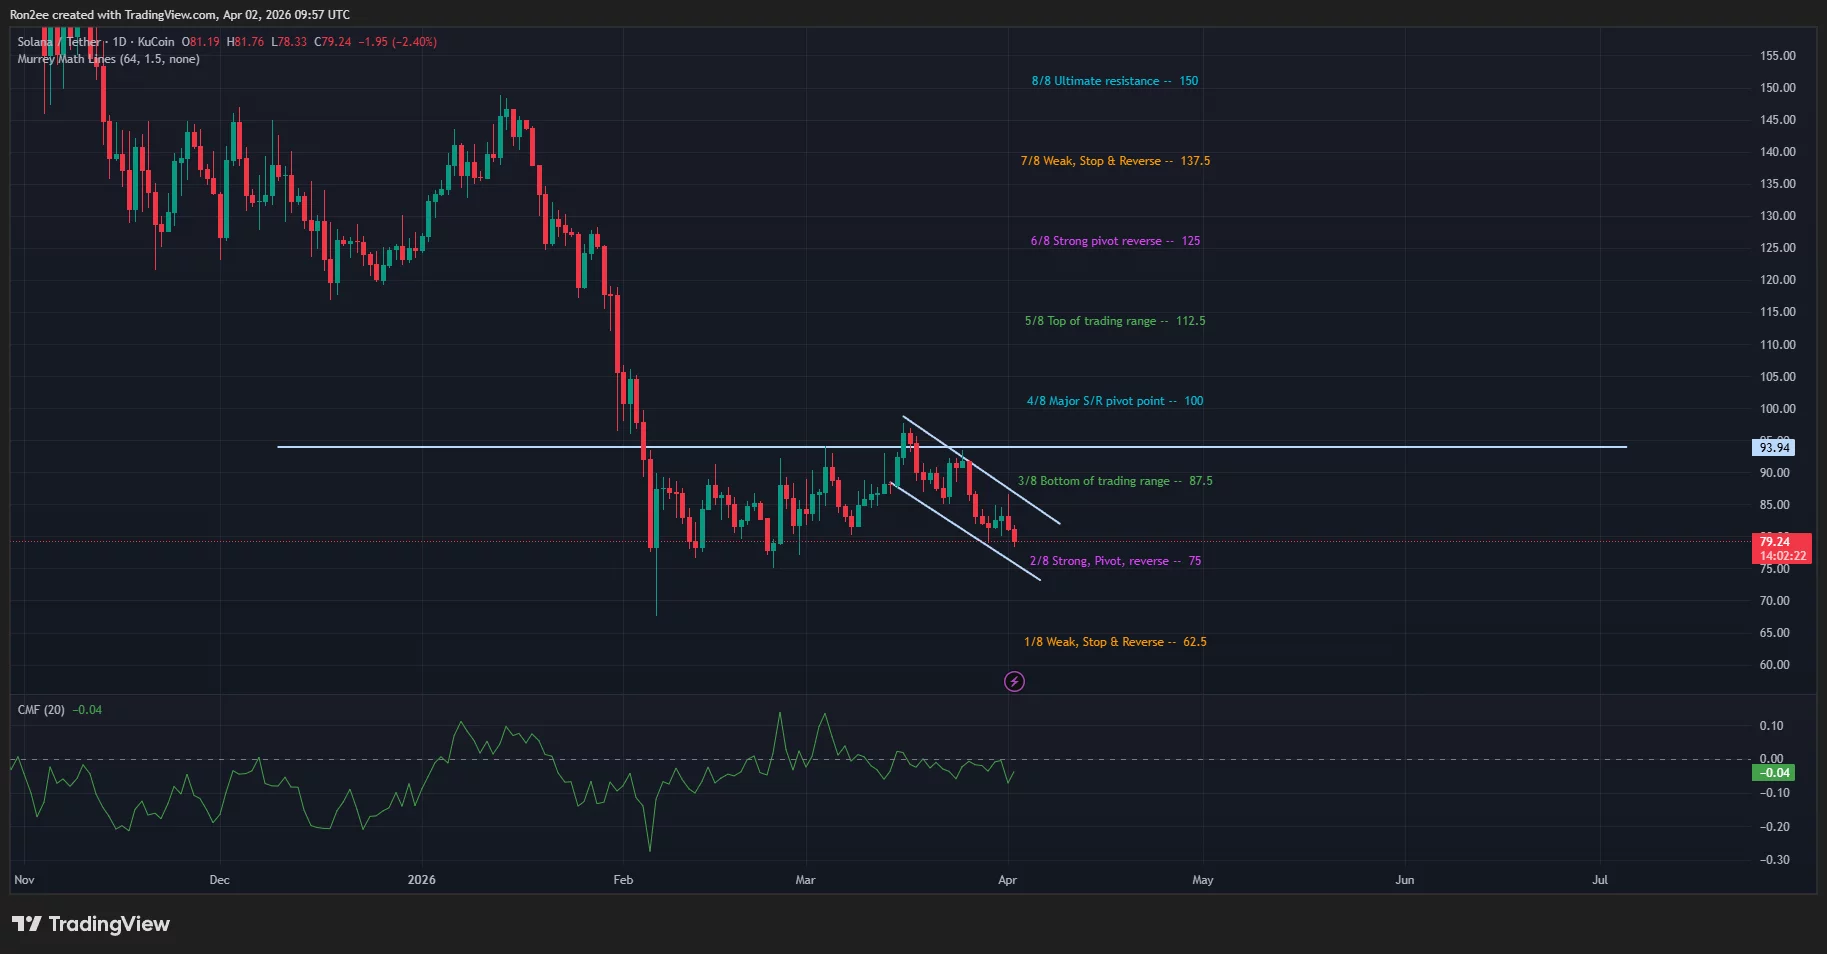
Technical indicators suggest more caution for traders over the short term. Notably, the 20-day SMA has formed a bearish crossover with the 50-day SMA.
Additionally, the Chaikin Money Flow index shows a negative reading of 0.04, a sign that investors are drawing away capital or funds from the Solana market, likely due to the recent security breach.
For now, $75, a support level that aligns with a strong pivot reverse of the Murrey Math lines, serves as the next key floor that traders should keep an eye on. A sharp drop below this level can accelerate the downward momentum.
On the contrary, a rebound above $93, a level where previous resistance sits, could signal the start of a new uptrend for the asset.
Disclosure: This article does not represent investment advice. The content and materials featured on this page are for educational purposes only.


추천 콘텐츠

Alphabet (GOOGL) Stock Nears $5 Trillion Market Cap Ahead of Google I/O Tuesday

Bonk Price Prediction: Is $BONK Entering a Bounce Zone After 80% Crash?