

Shiba Inu Price Prediction: Can SHIB Break $0.00000650 Resistance and Rally Higher?

Shiba Inu trades near a key resistance level while holding firm support. On-chain data and chart insights suggest a developing setup. While SHIB stabilizes near a demand zone, network activity shows signs of recovery, drawing attention to a potential breakout scenario.
Shiba Inu Holds Support as Descending Structure Persists
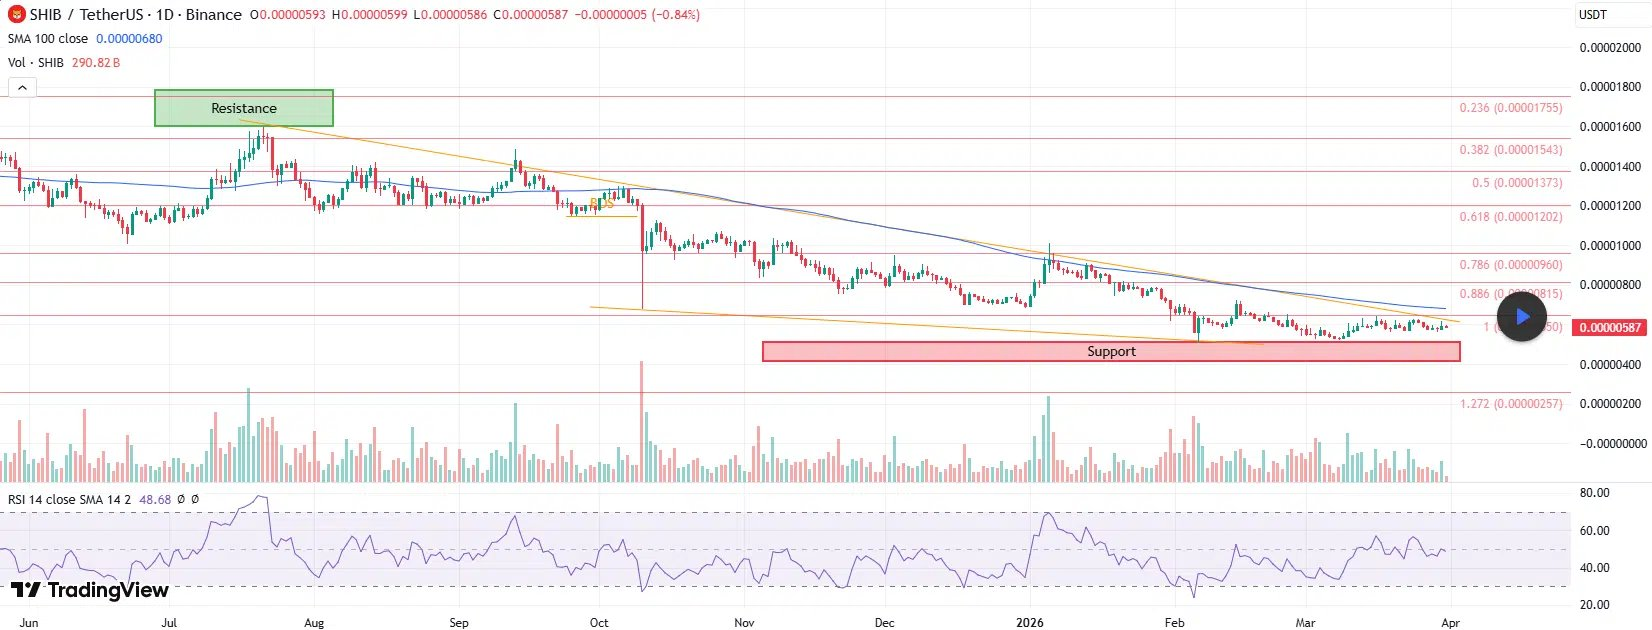
Shiba Inu is still trading in the larger descending pattern as seen in the daily chart. The price is forming lower highs and lower lows since the mid-year high. The trend remains under pressure.
 Source: X/thecrptobasic
Data provided by an analyst on X indicates that Shiba Inu is still holding up well in the range of $0.0000052 and $0.0000056. The range is the lower boundary of the descending channel. The price has repeatedly touched the range with bounces, which confirms it as the demand area.
There is some risk involved in repeatedly touching the same support area. The more the price tests the support area, the lower the chances of the buyers. The price is still holding well in the range; otherwise, the structure will be broken.
Resistance Zone Near $0.00000650 Defines Breakout Trigger
Shiba Inu has resistance levels between $0.00000645 and $0.00000650. These levels serve as resistance because the asset has previously rejected this zone. The levels are also connected to the descending trend line. The asset has not traded above this zone. This shows the asset has continued to experience sell pressure in the recent rallies.
The X user indicates that the asset may experience a significant move if the asset breaks the resistance levels. SHIB may move towards the next target if it breaks the resistance levels. The next target is at $0.00000815. This target is connected to the higher Fibonacci levels.
 Shiba Inu 4-hour chart
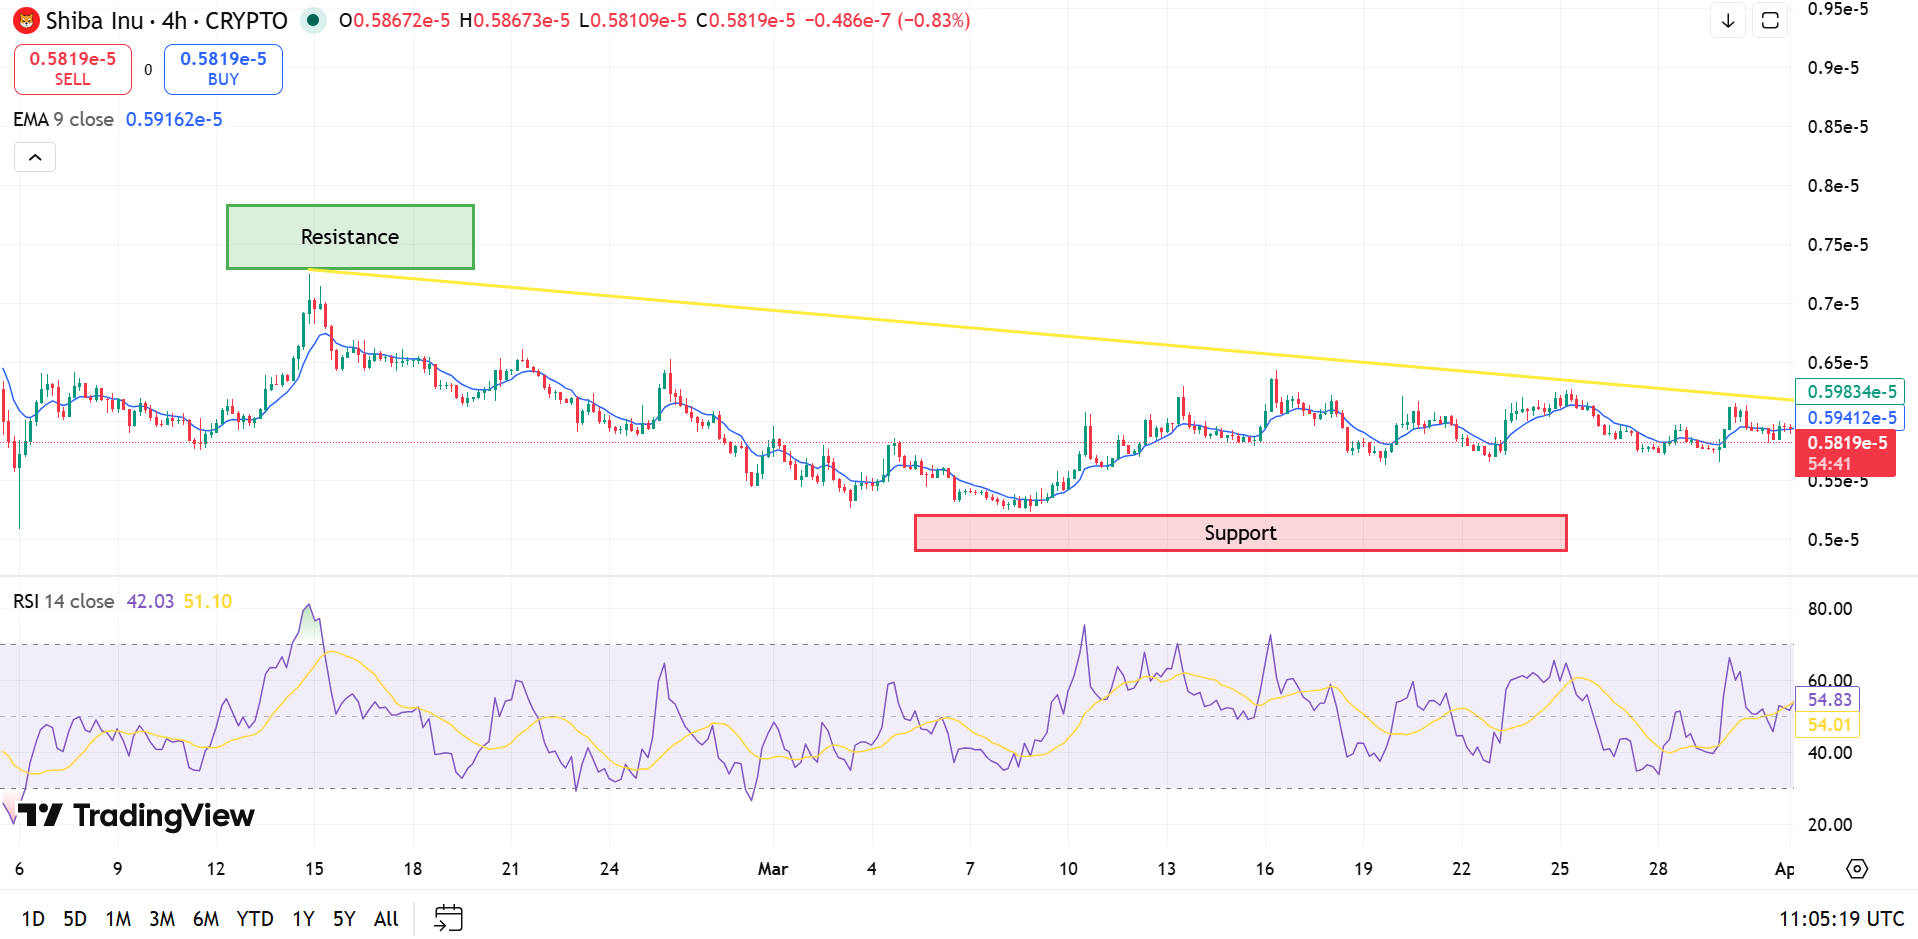
The 4-hour chart indicates the asset may move as projected. SHIB has consolidated below the descending resistance line. The asset has the potential to move above the line. The asset may move above the line because the asset has consolidated below the line.
Glassnode Data Shows Recovery in Market Activity
According to on-chain data provided by Glassnode, there has been a significant change in SHIB network activity. Market cap has reduced previously but has started increasing.
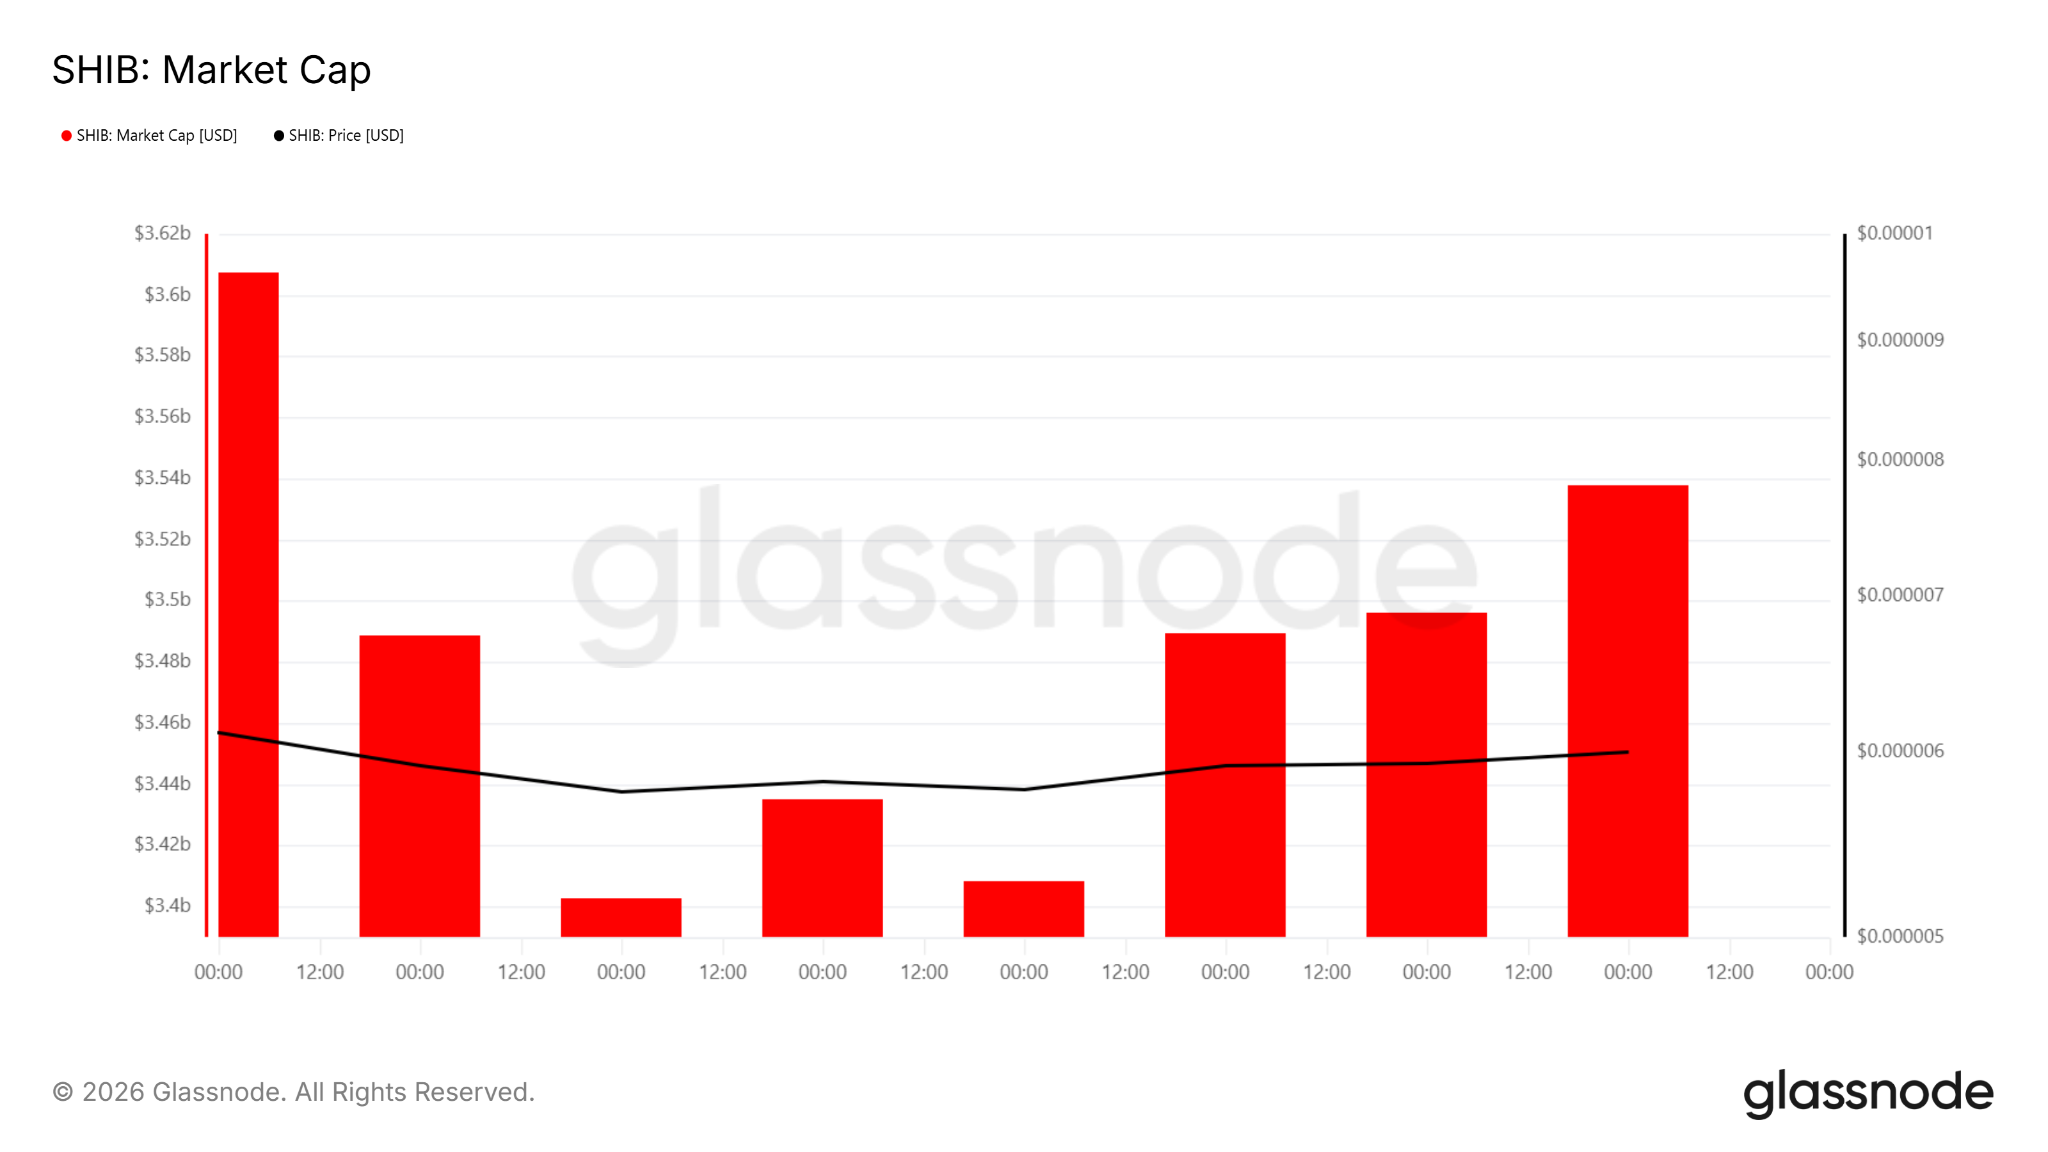 Shiba Inc’s Market Cap
Active addresses have also shown signs of improvement after facing a previous downfall. This is because the number of interacting active addresses has increased.
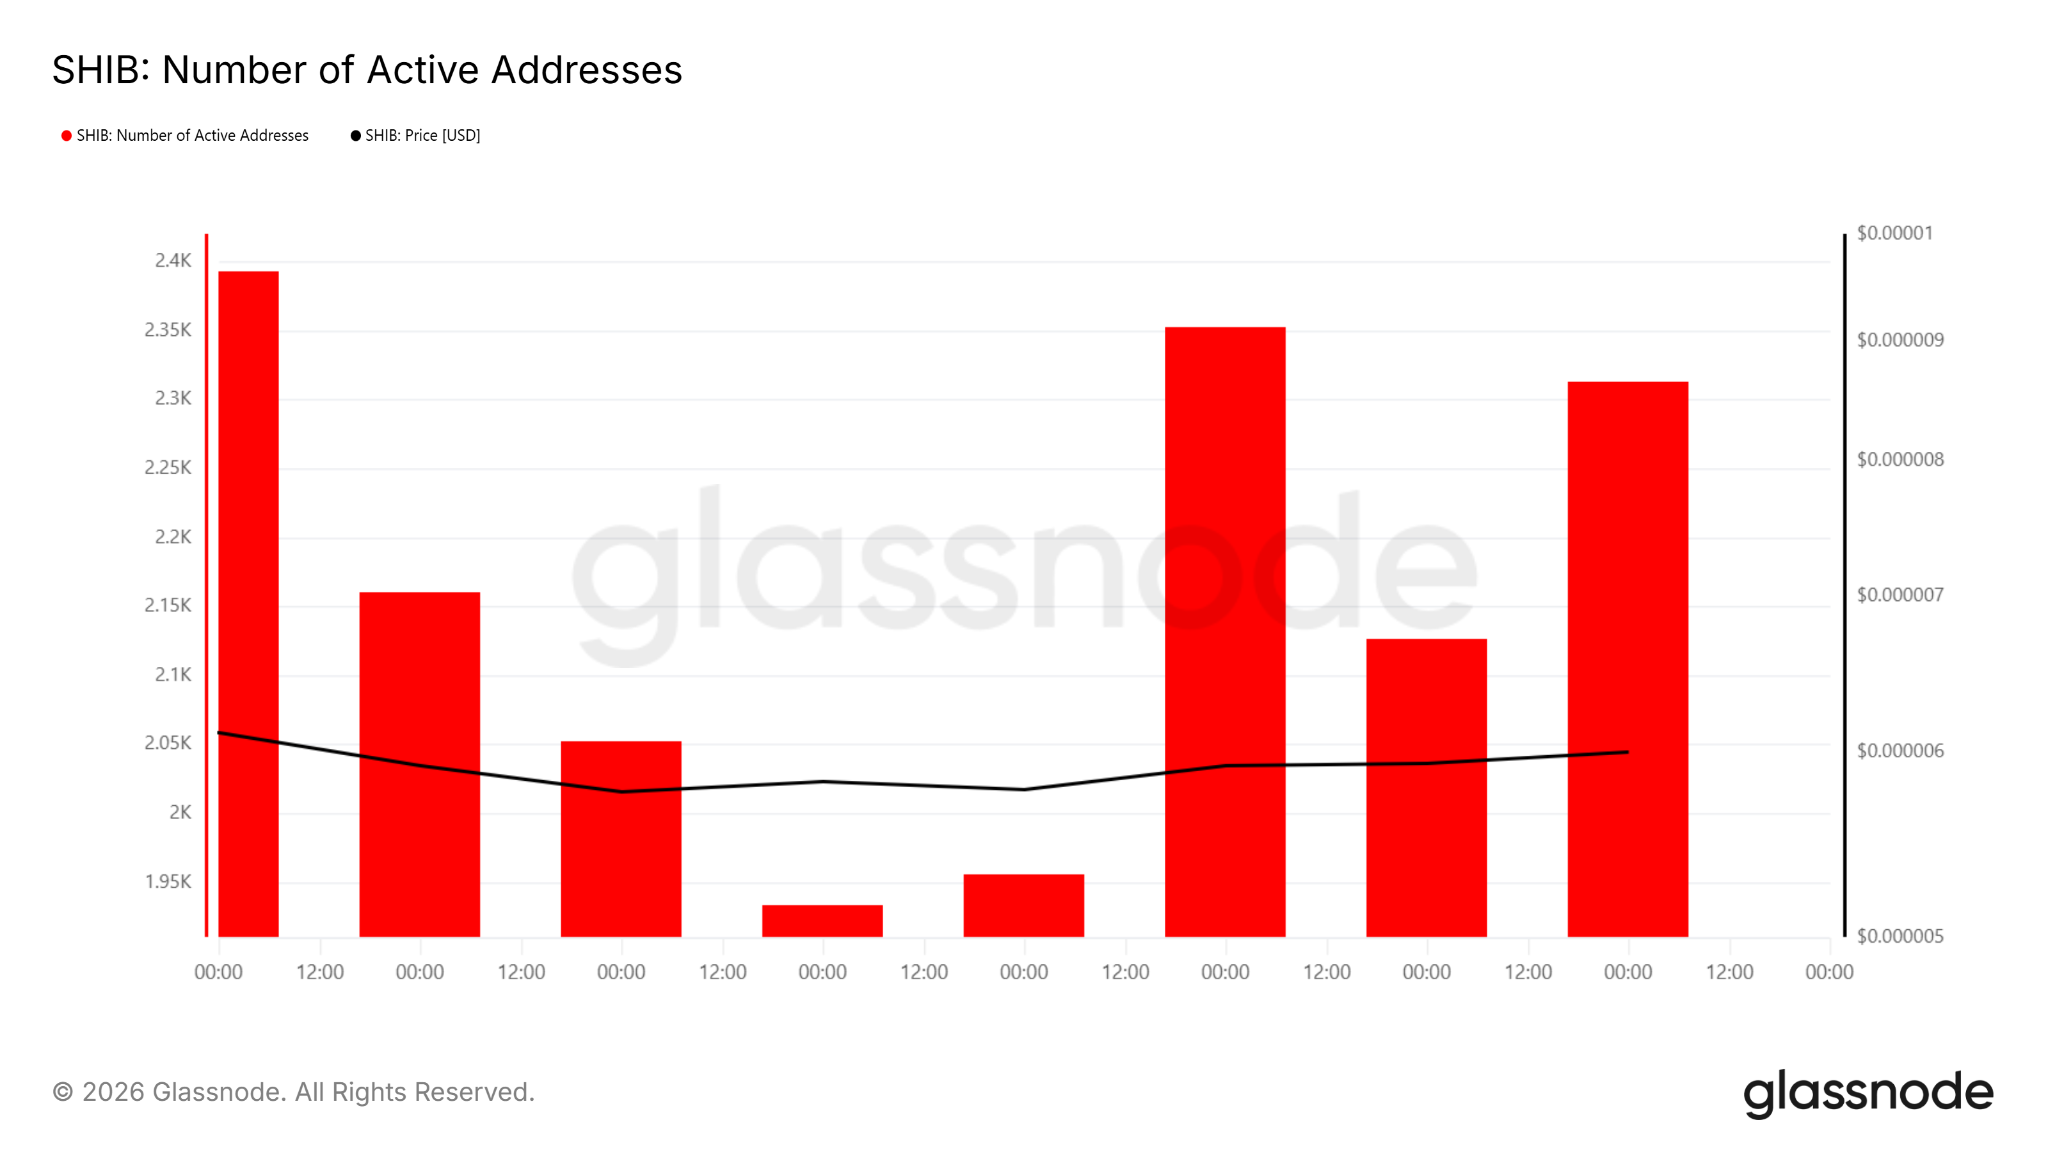 Shiba Inc’s Number of Active Addresses
Transfer count has also shown a similar pattern. It has increased after facing a previous downfall. It is a measure of the number of transfers made in the ecosystem. More transfers indicate increased trading.
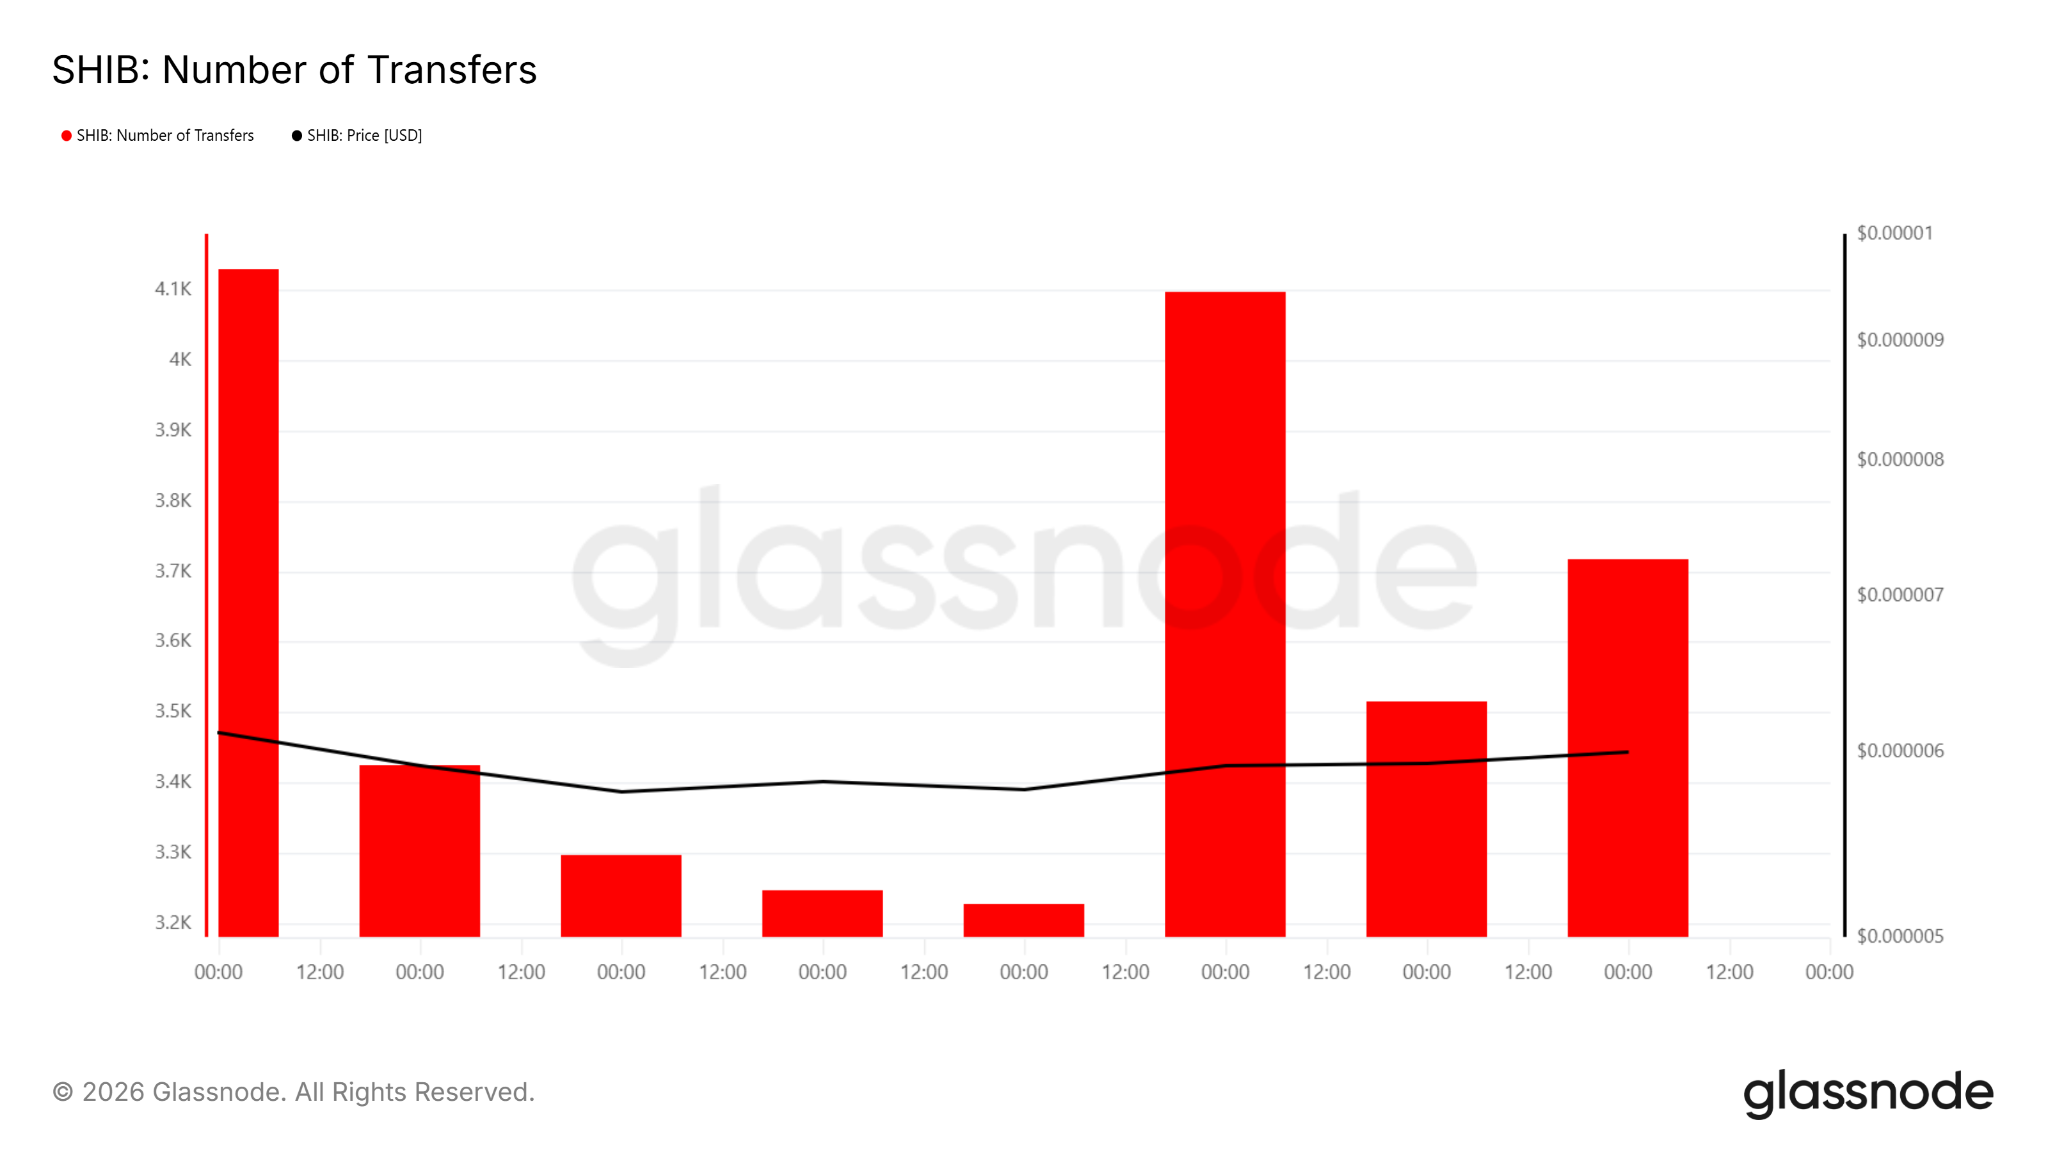 Shiba Inc’s Number of Transfers
Momentum Indicators Show Gradual Stabilization
Another aspect for Shiba Inu price prediction is momentum indicators. From the above chart, momentum indicators have provided additional information for Shiba Inu price prediction. On the daily chart, the price is still below strong bullish levels. This indicates that price recovery has not yet gained momentum.
On the 4-hour chart, the price has gained momentum as the RSI has crossed above the midpoint. This indicates a good sign for Shiba Inu price prediction. Moreover, the price is in a state of consolidation as indicated by the price chart.
Despite these positive signs for Shiba Inu price prediction, the price is still below the 100-day moving average. This is overhead resistance for Shiba Inu price prediction. The price needs to close above the descending trend line and the 100-day moving average.
So What Happens Next?
Shiba Inu price prediction currently depends on the reaction of the asset to two key levels. SHIB has continued to hold the key support levels of $0.0000052 and $0.0000056. The asset has not been able to go past the key resistance levels of $0.00000645 to $0.00000650. The asset has continued to be stuck in this range.
If the asset manages to go past the key resistance levels with enough follow-through, the asset may be able to move towards the $0.00000815 levels. This would be dependent on the asset being able to hold the key levels. The asset has continued to be stuck in this range.
Disclaimer: This analysis is based on market trends and does not guarantee future results. It should not be treated as financial advice. Cryptocurrency investments involve risk, so always do your own research (DYOR) before investing.


추천 콘텐츠

What next as Ripple-linked XRP rises to $1.33 but fails to break out

ZachXBT flags $420m in alleged USDC compliance lapses, raising questions over Circle’s enforcement


