Solana Price Under Pressure as Selling Activity Rises—Is More Downside Ahead?
The post Solana Price Under Pressure as Selling Activity Rises—Is More Downside Ahead? appeared first on Coinpedia Fintech News
Solana price is down by 1.5%, reaching $78.82, plunging below $80, and underperforming the broader market, primarily driven by continued fallout from a major ecosystem hack. The $285 million exploit on Solana-based Drift Protocol on April 01, 2026, remains a dominant overhang. The hack by the North-Korean hackers dropped Drift’s TVL from $530 million to $230 million, creating a liquidity crisis and community distrust. This has also pressured the SOL price as investors reassess ecosystem security risks.
As a result, the SOL price is showing a structural weakness in times when the broader market attempts to stabilise. Hence, the increase in the sell-side pressure is shaping a cautious outlook for the short term.
Price Structure Shows Weakness Near Key Support
Solana is trading at a critical support zone near $75–$78, with the current price hovering around $78–$80, showing clear signs of weakness after failing to sustain its recovery above $85. While the broader market is attempting to stabilise, SOL continues to lag, indicating a lack of strong buyer conviction at higher levels. This is not a trend continuation — it’s a pressure phase at support, where holding or losing this range will define the next move.
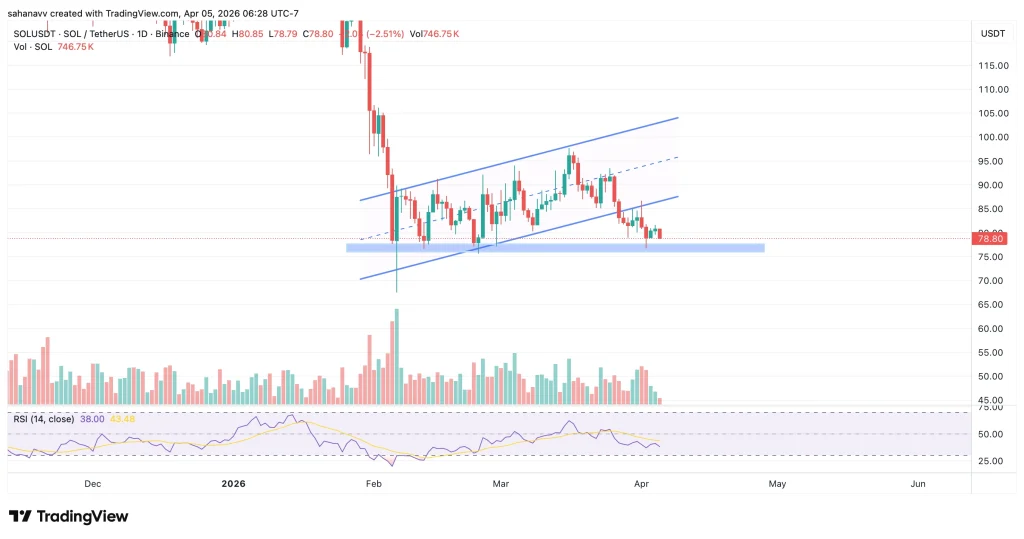
On the daily chart, SOL has broken down from an ascending channel and is now consolidating just above the $77 support, which aligns with key short-term levels. Repeated retests of this zone without a strong bounce suggest weakening demand. RSI is below neutral, reflecting fading momentum, while the structure shows lower highs forming after rejection near $90–$95 resistance.
If this support fails, the next downside targets open toward $73, followed by a deeper move toward $67–$70. On the upside, SOL needs to reclaim $85–$86 to regain short-term strength, with $93–$95 acting as the next key resistance zone.
TVL Decline Signals Capital Outflow
TVL reflects actual capital deployed within the ecosystem. A decline of this scale indicates reduced DeFi activity, lower user participation and Capital rotating out of the network. The DeFiLlama data shows a consistent drop in Solana’s TVL, falling from above $9 billion to nearly $5.5–$6 billion in recent weeks.
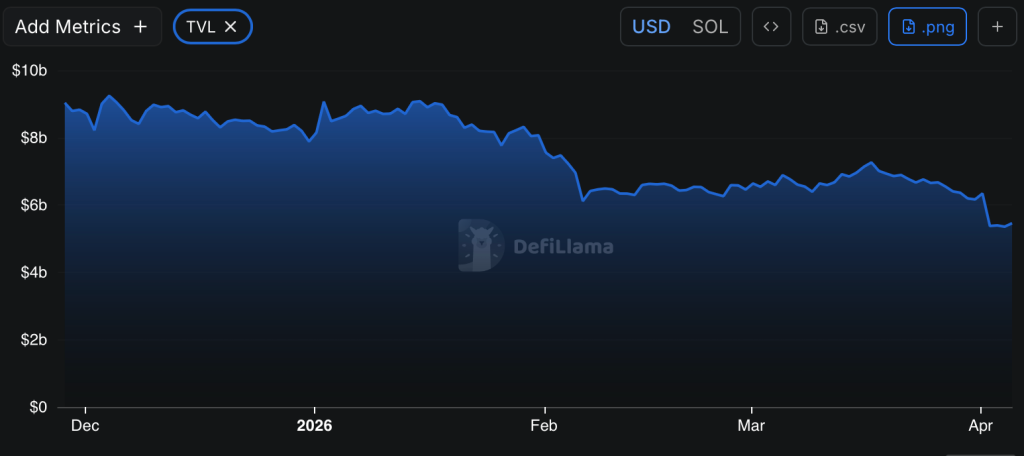
This indicates the funds withdrawn may be converted to stablecoins or other assets and rotated into other ecosystems. As TVL is a confidence metric, new capital hesitates when it drops, and existing holders reduce exposure. Therefore, the current decline, combined with the price sitting near support, indicates weak demand while the supply is rising.
What’s Next—Will SOL Price Secure Range Above $85 This Week?
The Solana price is not just reacting to price pressure; it is reflecting a broader slowdown in capital participation. The drop in TVL indicates that liquidity and user activity within the ecosystem are declining, which reduces the strength of any potential recovery.
At the same time, the price is holding near a key support zone around $75–$78, but without strong follow-through. This combination — weak structure on the chart and declining TVL — suggests that the current phase is more of a fragile hold than a strong base.
In practical terms, this limits upside in the near term. Even if SOL attempts a bounce, the absence of capital inflow makes it difficult to sustain higher levels. For a meaningful move higher, the price needs to stabilise while TVL either stops declining or begins to recover. Until that shift happens, the current setup points toward slow, reactive price action with downside risk remaining elevated rather than a clear trend reversal.


추천 콘텐츠

Spot CVD Chart Reveals Critical Bitcoin Support Levels as Institutional Orders Surge on April 2

Bitcoin Exchange Supply Hits Lowest Level Since 2018 While Ethereum Supply Rises