XRP Price Analysis: From $3 to Potential $36 With Historic Cup Breakout
- XRP trades at $3.02 after recovering from September lows.
- Chart analysis points to a potential path toward $36 in the coming quarters.
- A decade-long structure shift signals the start of a major uptrend.
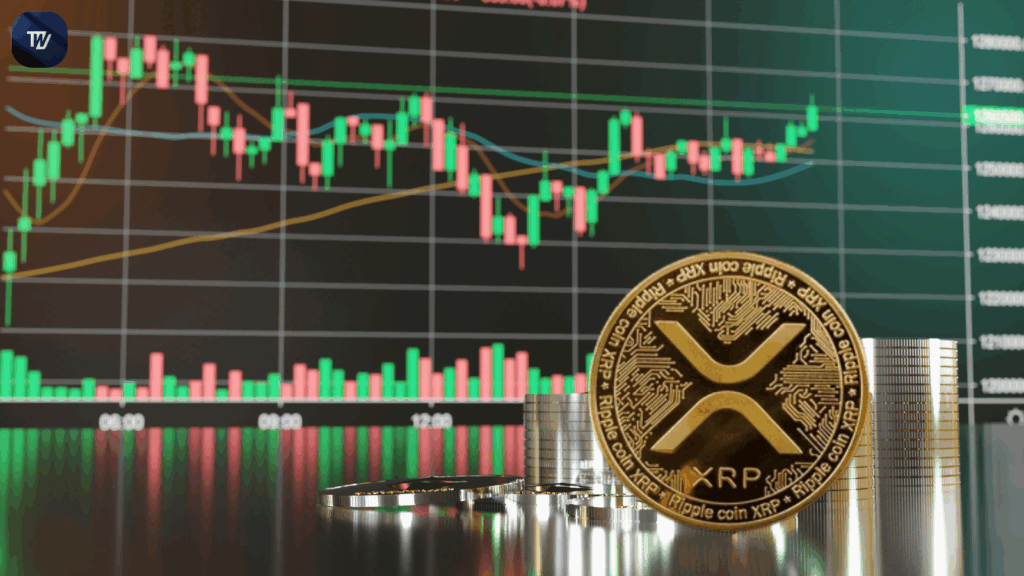
XRP has been testing its resilience in recent months. After reaching $3.66 in July 2025, the coin slipped to $2.70 on September 1. Buyers immediately returned to the market, taking it back above $3.00. At the current press time, the token is trading at $3.02 with market players waiting to see where it will go next.
 Source: CoinMarketcap
Dark Defender, a chartist who has a community following, thinks XRP’s current pattren is similar to what he believes to be the “flight of the phoenix.”
He thinks in his analysis that the token is probing a crucial level again for a potential massive surge. He felt a complete “cup pattern” formed by monitoring the long-term chart would take XRP to $36.
Also Read: XRP Holds $3 Support as Bulls Eye a Break Above $3.10
XRP Historical Patterns Support Bold Projection
Chart analysis by a defender aligns XRP’s price history into two long cup-like patterns. The first one, from 2013 to 2017, ended with a sharp surge once the resistance was eliminated. The second one, from 2018 to 2025, has itself just broken free from an eight-year bear trend.
The chart suggests that the token has moved out of distribution into expansion on a quarterly horizon. On a closing basis, for the first time in years, the lower trend line that capped rallies since 2018 has been broken.
 Source: X
After the breakout, XRP corrected back into the same region, which is acting as support currently. Such a “break and retest” chart pattern is typically related to sustainable changes in trends.
It pinpoints major upside objectives: $5.86 as a starting level, $18.23 as a possible mid-stage objective, and $36.77 as a final extension should momentum be maintained. These levels represent Fibonacci goals commonly applied with technical trading.
Faster Path Points Toward $10–$18 in Coming Quarters
Even if things appear to be good, threats remain. A close below the $1.00 to $1.70 level would weaken the bull’s stand. Abandoning the long-term chart’s parabolic support curve would also be an exhaustion signal.
Baseline scenario suggests that XRP could consolidate within the $3 to $4 area before expanding to $6. A faster pathway could take the coin to $10 to $18 region within the next quarters. High-end goal $36 is seen as viable only if momentum is continuous and liquidity increases dramatically.
As seen with September’s trading showing resilience, investors currently wait for the final quarter of 2025 to see if XRP begins its much-anticipated phoenix rise.
Also Read: Will XRP Price Increase In September 2025?
추천 콘텐츠

XRP ETFs Outflows Slow as Goldman Sachs Tops Holdings

Next Crypto to Explode: Sharplink Loses $735M on Ethereum but Keeps Accumulating as Pepeto’s 100x Exchange Presale Earns From Both Sides of Every Trade