

Crypto Market Weekly Review (September 15-21): US Interest Rate Cut Cycle Restarts, BTC Slightly Dips
The information, opinions and judgments on markets, projects, currencies, etc. mentioned in this report are for reference only and do not constitute any investment advice.
Author: 0xBrooker
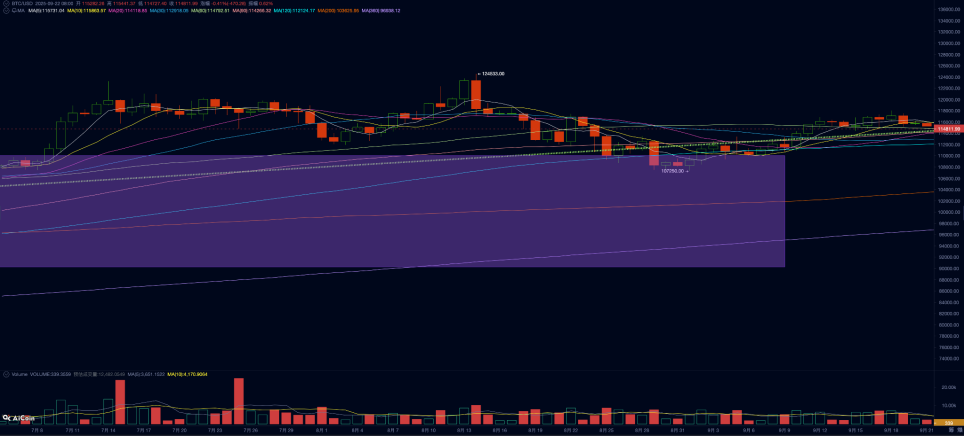
BTC daily trend
Policy, macro-financial and economic data
On September 17, Eastern Time, at the much-anticipated FOMC meeting, the Federal Reserve officially restarted the interest rate cut cycle, reducing it by 25bp to 4.00%~4.25%. The discount rate was also lowered to 4.25%, while continuing to shrink its balance sheet (QT) at the established pace.
Federal Reserve Chairman Powell stated, "Economic growth slowed in the first half of the year, employment growth weakened, unemployment rose, and inflation rebounded but remains elevated." The current rate cut is primarily aimed at managing the "risk of weakening employment" and striking a balance between still-elevated inflation and a softening labor market. Subsequent actions will depend on data and be assessed on a case-by-case basis. This means that within its dual mandate, the Fed has officially shifted its focus to employment.
The dot plot shows that the median value at the end of 2025 is 75bp lower than the previous one, indicating that most members agree to start a cycle of interest rate cuts. The disagreement lies in the pace and space of interest rate cuts, and a few members support faster interest rate cuts.
While the market had already priced in three rate cuts this year, this price-in further increased after the meeting. This led to increased volatility in the US dollar index during the week, but it ultimately declined before rising, closing at 97.665. Selling of long-term US Treasury bonds increased slightly, with yields rising 1.35%. The Nasdaq, S&P 500, and Dow Jones all rose 2.21%, 1.22%, and 1.05%, respectively, reaching new record highs.
The current rally in US stocks is driven by increased risk appetite following the start of the interest rate cut cycle and AI-driven performance growth. This trend is expected to continue, but will also be constrained by inflation data. The stock market rose 1.05% during the Golden Week holiday.
Crypto Market
Due to the early completion of pricing and insufficient follow-up funds, BTC underperformed the Nasdaq this week, with a slight drop of 0.03%.
This week, BTC opened at $115,314.12 and closed at $115,282.27, with a high of $117,998.17 and a low of $114,395.84, a weekly decrease of 0.03%. The trading volume remained flat, and the overall trend was a narrow range of first rising and then falling.
Technically, BTC closed above the first rising trend line of the bull market and was supported by the 60-day moving average.
In terms of coin holding structure, after increasing holdings last week, long-term holders started selling 25,149 coins again this week, bringing greater upward pressure to the market.
In terms of cost-benefit, the average long-term value is more than 2 times, indicating that long-term selling has a rich profit return, and the short-term value is around 1, indicating that this group did not sell at a loss.
The long-term floating profit value is 3.16%, which still has a large floating profit. The short-term floating profit value is 1.04%, which does not put pressure on the market.
Due to forward trading, capital inflows into the crypto market this week declined significantly compared to last week. Total inflows this week totaled $7.107 billion, down from $9.539 billion last week. This included $889 million into the BTC Spot ETF channel, $129 million into the BTC DATs channel, $550 million into the ETH Spot ETF channel, $366 million into the ETH DATs channel, $2.544 billion into the SOL DATs channel, and $2.589 billion into stablecoins.
Another factor creating psychological pressure on the market is the cyclical nature of Bitcoin. September to December is the peak period for Bitcoin prices in previous cycles, which may be the reason for the continued selling of long-term Bitcoin holders, especially those with over seven years of holdings.
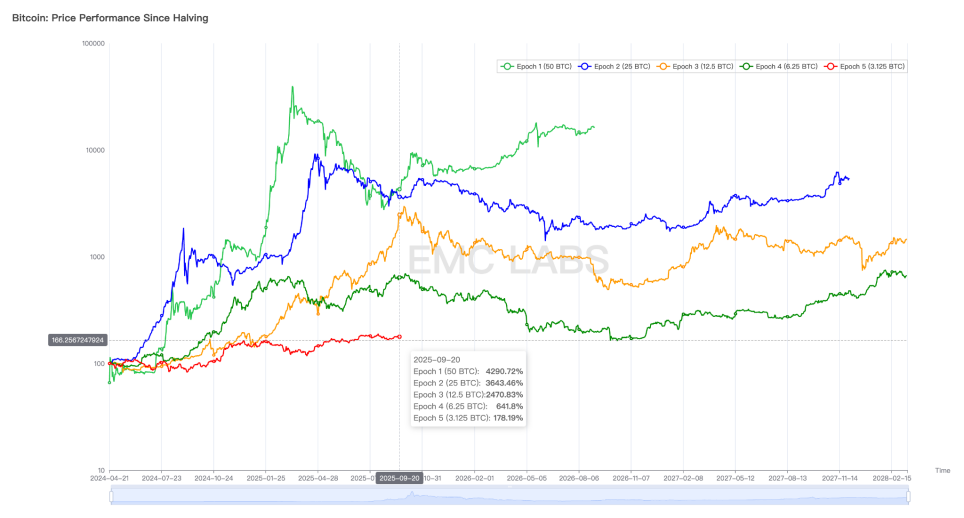
Comparison of BTC price trends after previous halvings
From the perspective of industrial policies, capital inflows and macro-financial cycles, the current period is the best expansion period for crypto assets. However, it remains to be seen whether BTC and the entire Crypto will break free from the constraints of cyclical rates and form new market rules and cycles.
As the U.S. restarts its interest rate cut cycle, whether BTC and crypto assets can take another step forward depends on whether the selling pressure can be fully absorbed. The market will give the answer in the coming months.
Cycle indicators
According to eMerge Engine, the EMC BTC Cycle Metrics indicator is 0.25, which is in the rising relay period.


추천 콘텐츠

XRP flips green after a 63% wipeout as retail fear hits a 2-year extreme – now one Wall Street metric is spiking

UAE faces talent squeeze as war dents hiring


