The post Ethereum Price Slips Below $4,200 – Can Bulls Defend $4,000? appeared first on Coinpedia Fintech News Ethereum has come under heavy selling pressure, slipping below $4,200 after a sharp daily decline of nearly 7%. The move wiped out more than $44 billion in market value in less than a week and left traders questioning whether bulls can hold the $4,000 psychological zone. With ETH now down over 15% from its all-time …The post Ethereum Price Slips Below $4,200 – Can Bulls Defend $4,000? appeared first on Coinpedia Fintech News Ethereum has come under heavy selling pressure, slipping below $4,200 after a sharp daily decline of nearly 7%. The move wiped out more than $44 billion in market value in less than a week and left traders questioning whether bulls can hold the $4,000 psychological zone. With ETH now down over 15% from its all-time …

Ethereum Price Slips Below $4,200 – Can Bulls Defend $4,000?

2025/09/22 19:32
3분 읽기
이 콘텐츠에 대한 의견이나 우려 사항이 있으시면 crypto.news@mexc.com으로 연락주시기 바랍니다
Ethereum Price

The post Ethereum Price Slips Below $4,200 – Can Bulls Defend $4,000? appeared first on Coinpedia Fintech News

Ethereum has come under heavy selling pressure, slipping below $4,200 after a sharp daily decline of nearly 7%. The move wiped out more than $44 billion in market value in less than a week and left traders questioning whether bulls can hold the $4,000 psychological zone. With ETH now down over 15% from its all-time high of $4,953 set just a month ago, the market faces both technical and macro headwinds.

Ethereum Price Analysis

Ethereum currently retails across exchanges at $4,173, marking a 6.89% drop in 24 hours and an 8.13% weekly decline. The sharp pullback coincides with a surge in trading volume, which jumped 122% to $41.86 billion. Market cap now stands at $500.67 billion.

Technically, ETH broke below several critical supports, one at the 30-day SMA, which is $4,465, the 78.6% Fibonacci retracement at $4,378, and the $4,394 horizontal support seen on the charts. Momentum indicators confirm the bearish tilt, with the RSI at 18.7, signaling extreme oversold conditions. Successively, the MACD histogram at -13.94 shows acceleration in downside momentum.

ETH price analysis 22-9-25

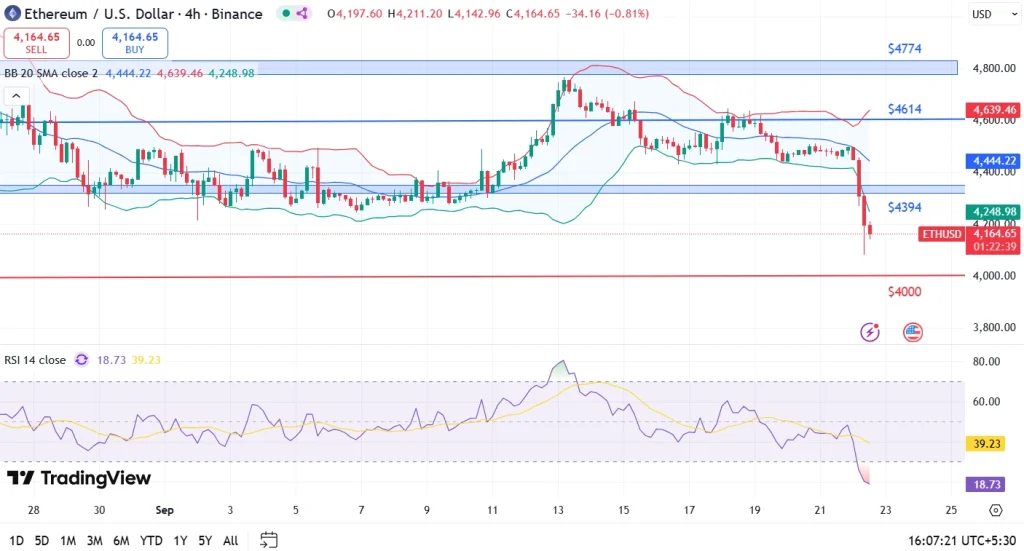
This steep fall was likely triggered by cascading liquidations. Successively, $452M in total liquidations were seen in the last 24 hours. This is with 72% being long positions, suggesting traders’ stop-losses were triggered once ETH fell under $4,400. The $4,221–$4,000 zone, which aligns with June’s swing low, now stands as the critical support area. If broken, downside could extend toward the distant 200-day EMA at $3,393.

Sentiment and Security Risks

From a sentiment perspective, the Fear & Greed Index fell to 47, signaling a shift from mild optimism to a more cautious stance compared to 51 just last week. Ethereum’s higher turnover ratio of 8.71%, versus Bitcoin’s 5.2%, shows that traders are offloading higher-beta assets like ETH. This is amid uncertainty around Federal Reserve policy moves and ongoing turmoil in Chinese markets. With $1.01 trillion in derivatives open interest, conditions were primed for cascading stop-loss triggers, amplifying the recent selloff.

On the security front, reports of phishing campaigns tied to EIP-7702 wallets resurfaced this week. $150,000 was siphoned off through malicious contract approvals. While this is not a direct protocol flaw, it raises adoption concerns. Industry responses will be key, with MetaMask already planning to roll out a “transaction simulation” feature in Q4 2025 to help users avoid such exploits.

FAQs

Why is the Ethereum price dropping today?

ETH is falling due to cascading liquidations, weaker sentiment, and macro concerns like Fed policy and China’s market risks.

What key levels should traders watch?

Immediate support lies at $4,000. Resistance zones are $4,394 and $4,465.

Is Ethereum still in a long-term uptrend?

Yes, despite short-term volatility, ETH remains well above its 200-day EMA at $3,393, keeping its long-term trend intact.

시장 기회
Moonveil 로고
Moonveil 가격(MORE)
$0.00004082
$0.00004082$0.00004082
+2.84%
USD
Moonveil (MORE) 실시간 가격 차트
면책 조항: 본 사이트에 재게시된 글들은 공개 플랫폼에서 가져온 것으로 정보 제공 목적으로만 제공됩니다. 이는 반드시 MEXC의 견해를 반영하는 것은 아닙니다. 모든 권리는 원저자에게 있습니다. 제3자의 권리를 침해하는 콘텐츠가 있다고 판단될 경우, crypto.news@mexc.com으로 연락하여 삭제 요청을 해주시기 바랍니다. MEXC는 콘텐츠의 정확성, 완전성 또는 시의적절성에 대해 어떠한 보증도 하지 않으며, 제공된 정보에 기반하여 취해진 어떠한 조치에 대해서도 책임을 지지 않습니다. 본 콘텐츠는 금융, 법률 또는 기타 전문적인 조언을 구성하지 않으며, MEXC의 추천이나 보증으로 간주되어서는 안 됩니다.

추천 콘텐츠

Edges higher ahead of BoC-Fed policy outcome

Edges higher ahead of BoC-Fed policy outcome

The post Edges higher ahead of BoC-Fed policy outcome appeared on BitcoinEthereumNews.com. USD/CAD gains marginally to near 1.3760 ahead of monetary policy announcements by the Fed and the BoC. Both the Fed and the BoC are expected to lower interest rates. USD/CAD forms a Head and Shoulder chart pattern. The USD/CAD pair ticks up to near 1.3760 during the late European session on Wednesday. The Loonie pair gains marginally ahead of monetary policy outcomes by the Bank of Canada (BoC) and the Federal Reserve (Fed) during New York trading hours. Both the BoC and the Fed are expected to cut interest rates amid mounting labor market conditions in their respective economies. Inflationary pressures in the Canadian economy have cooled down, emerging as another reason behind the BoC’s dovish expectations. However, the Fed is expected to start the monetary-easing campaign despite the United States (US) inflation remaining higher. Investors will closely monitor press conferences from both Fed Chair Jerome Powell and BoC Governor Tiff Macklem to get cues about whether there will be more interest rate cuts in the remainder of the year. According to analysts from Barclays, the Fed’s latest median projections for interest rates are likely to call for three interest rate cuts by 2025. Ahead of the Fed’s monetary policy, the US Dollar Index (DXY), which tracks the Greenback’s value against six major currencies, holds onto Tuesday’s losses near 96.60. USD/CAD forms a Head and Shoulder chart pattern, which indicates a bearish reversal. The neckline of the above-mentioned chart pattern is plotted near 1.3715. The near-term trend of the pair remains bearish as it stays below the 20-day Exponential Moving Average (EMA), which trades around 1.3800. The 14-day Relative Strength Index (RSI) slides to near 40.00. A fresh bearish momentum would emerge if the RSI falls below that level. Going forward, the asset could slide towards the round level of…
공유하기
BitcoinEthereumNews2025/09/18 01:23
MEXC Publishes April 2026 Proof of Reserves, BTC Reserve Ratio Rises to 295%

MEXC Publishes April 2026 Proof of Reserves, BTC Reserve Ratio Rises to 295%

VICTORIA, Seychelles, April 15, 2026 (GLOBE NEWSWIRE) -- MEXC, the world leader in 0‑fee digital asset trading, published its April 2026 Proof of Reserves.
공유하기
CryptoReporter2026/04/15 18:00
Survey Reveals Widespread Confusion About Cryptocurrency Tax Obligations

Survey Reveals Widespread Confusion About Cryptocurrency Tax Obligations

Coinbase survey reveals over 50% of crypto users don't understand tax rules, highlighting compliance risks and education gaps in the growing digital asset industry
공유하기
Citybuzz2026/04/02 22:05

USD1 Genesis: 0 Fees + 12% APR

USD1 Genesis: 0 Fees + 12% APRUSD1 Genesis: 0 Fees + 12% APR

New users: stake for up to 600% APR. Limited time!