

QNT Price Breakdown: Losing $70 Could Trigger Deeper Slide

The post QNT Price Breakdown: Losing $70 Could Trigger Deeper Slide appeared first on Coinpedia Fintech News
The QNT price keeps loosing its footing and not in a subtle way. Slipping below the $70 level, a zone that acted like a psychological safety net for weeks, the structure has quietly flipped from “maybe stable” to “probably not.” And, that changes everything.
QNT $70 Support Collapse Shifts Market Structure Bearish
For most of late March and April, $70 wasn’t just another number. It was the floor. The pivot. The line traders kept coming back to. Now it’s gone.
Daily closes below this level signal more than just weakness as they invalidate the entire sideways accumulation phase. That kind of breakdown doesn’t usually end with a polite bounce. It tends to invite stop-loss cascades and, well, more downside.
So, what used to be support? It’s now resistance. Simple, brutal flip.
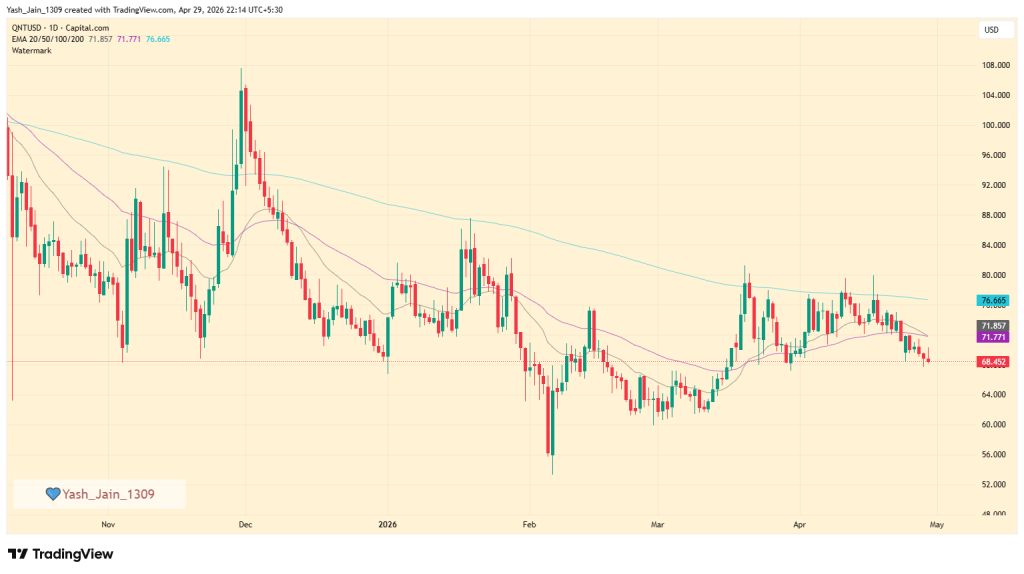 Source: QNT/USD TradingView
EMA Cluster Now Acting as Heavy Resistance
But here’s where it gets worse. The QNT price isn’t just below $70 but it’s also trading under its key EMAs. The 20-day and 50-day averages, sitting near $71.85, have effectively formed a ceiling. Every attempt to push higher gets smacked down.
Call it a rejection zone. Or, more accurately, a “death hug.” Even the 200-day EMA at $76.66 looms overhead as a longer-term barrier. So any relief rally? It’s walking straight into layers of resistance.
Momentum Indicators Show No Signs of Recovery
Now let’s talk momentum because right now, it’s not on the bulls’ side. The MACD is sitting deep in negative territory at -0.752, with no hint of a bullish crossover. The trend isn’t slowing; it’s drifting lower.
Then there’s the Awesome Oscillator, printing red bars below zero. Not only is momentum bearish but it’s accelerating.
And just to round it off, the RSI is hovering at 40.02. That’s not oversold yet, but it’s getting uncomfortably close. Translation? There’s still room to fall.
Meanwhile, CMF sits at -0.11, quietly confirming that capital is flowing out. This isn’t random volatility but this could be it’s distribution.
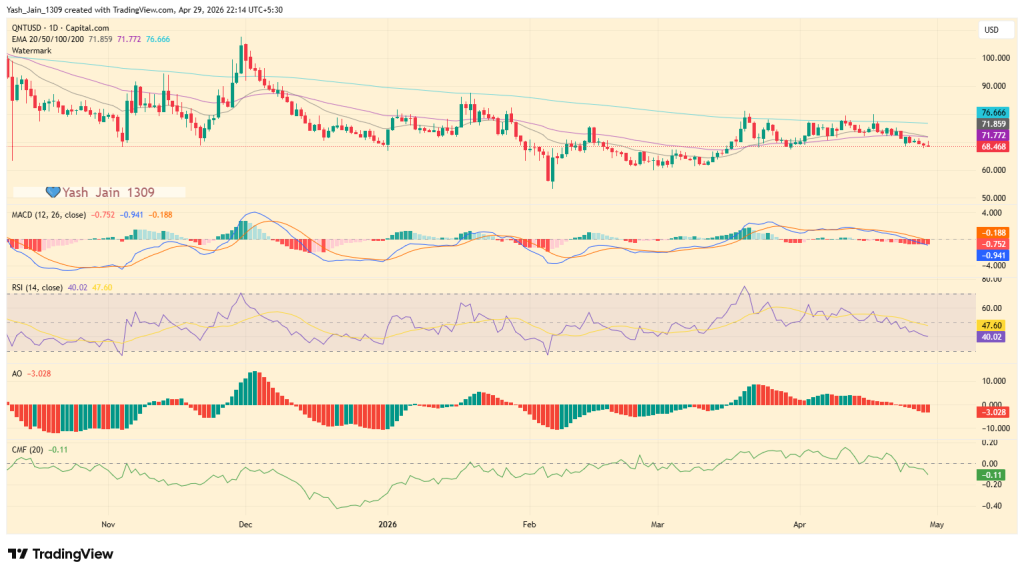 Source: QNT/USD TradingView
Downside Targets Now Come Into Focus
So, with $70 gone, the market starts hunting lower liquidity zones. First stop: $64–$65. That’s where QNT/USD previously paused, and it’s likely to test that area again.
If that fails and odds suggests it might then in that case the next psychological level sits at $60. Round numbers like that tend to attract attention, but they’re not guaranteed to hold.
And then there’s $56. The last real safety net. Lose that, and the broader structure starts looking… fragile.
For now, the QNT price needs to reclaim $72 and flip those EMAs back into support to even start talking about recovery. Until then, the path of least resistance? Still pointing down.


추천 콘텐츠

XRP ETFs rebound with $25.8M inflows – Can falling supply fuel a rally?

The Best Crypto Books Every Blockchain Beginner Should Read


