Bitcoin Price Faces Defining Moment of 2026 as Bulls Fight for Breakout Confirmation

The post Bitcoin Price Faces Defining Moment of 2026 as Bulls Fight for Breakout Confirmation appeared first on Coinpedia Fintech News
Bitcoin price is approaching a defining moment of 2026 as bulls and bears battle around a major breakout zone near the 200-day SMA. After weeks of recovery, BTC is now facing rising miner selling pressure, overheated leverage positions, and weakening breakout momentum just as volatility compresses into a critical decision area.
While institutional demand and ETF-driven optimism continue supporting the broader market structure, analysts warn that Bitcoin’s latest rally may be entering its most vulnerable phase yet. Traders are aggressively increasing risk exposure even as miners offload reserves and liquidity clusters build below current price levels.
With BTC hovering near a make-or-break resistance barrier near $82K, the next move could decide whether Bitcoin extends toward a fresh six-figure rally or triggers a sharp liquidity-driven correction before the next expansion phase begins.
Miner Selling Pressure Begins Rising
On-chain data suggests Bitcoin miners have started distributing holdings into the latest rally, adding pressure near a critical resistance zone. BTC miner reserves have steadily declined since Bitcoin price rebounded from the $72,000 region, signaling active profit-taking from miners as BTC trades near yearly highs. Historically, increased miner selling near resistance levels tends to strengthen overhead supply and slow bullish continuation momentum.
The latest distribution phase arrives as Bitcoin attempts to reclaim a major long-term resistance cluster, making the current structure increasingly sensitive to additional sell-side pressure.
Leverage Builds Across Futures Markets
While miners appear to be reducing exposure, derivatives traders are aggressively increasing bullish positions. Data shows Bitcoin’s Estimated Leverage Ratio climbing toward yearly highs across major futures exchanges, reflecting growing speculative activity. Elevated leverage often increases the probability of sharp volatility spikes, especially when price trades near key breakout zones.
Most of the current positioning remains heavily skewed toward longs, creating large liquidity clusters below the market. Analysts identified major liquidation zones near $75,000, $73,000, and $70,000, levels that could attract price if Bitcoin loses momentum around resistance. The imbalance between rising leverage and weakening breakout strength is now becoming one of the market’s most closely watched risks.
MVRV Data Signals Structural Market Shift
Beyond short-term volatility, some analysts believe Bitcoin’s long-term cycle behavior is beginning to change. Data shows Bitcoin’s MVRV ratio continues narrowing compared to previous cycles, suggesting declining volatility expansion as institutional participation grows. The approval of spot Bitcoin ETFs and rising traditional finance involvement are gradually reshaping the market’s structure.
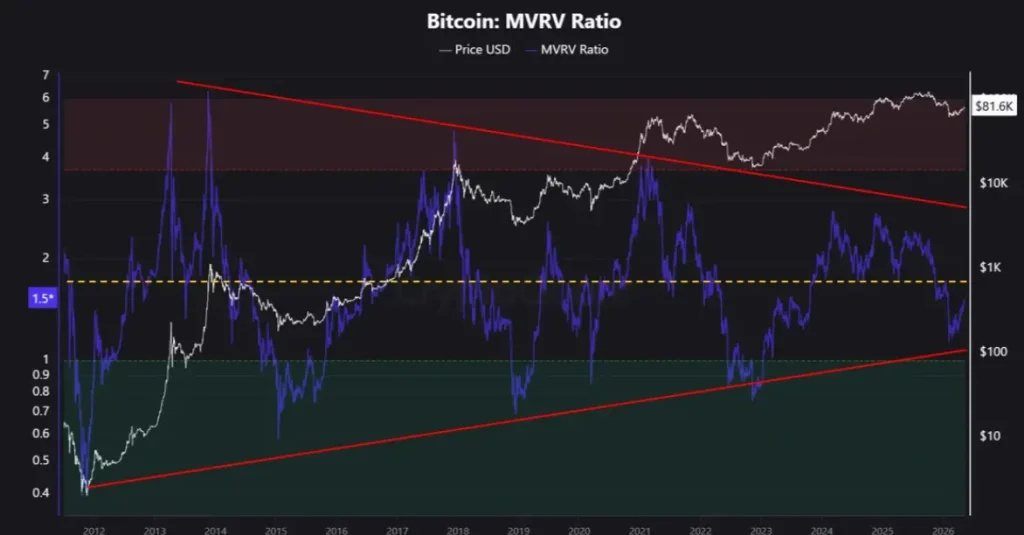
Instead of extreme boom-and-bust cycles driven mainly by retail speculation, analysts believe Bitcoin could increasingly move through slower but more sustainable expansion phases supported by institutional capital inflows. The shift is also forcing traders to rethink traditional cycle models, as Bitcoin’s evolving market dynamics continue diverging from previous bull market behavior.
Bitcoin Price Analysis: Why the “Indecision Zone” Matters
Bitcoin price is currently trading inside a critical indecision zone near the $80,000–$82,500 range, where bulls and bears continue battling for trend confirmation. The chart shows BTC repeatedly testing the 200-day SMA resistance near $82,500, but buyers have so far failed to secure a strong breakout above the level. The market structure still remains bullish as Bitcoin continues printing higher lows while holding above the ascending support trendline formed since the March bottom. However, the lack of strong follow-through volume near resistance suggests momentum is beginning to slow down in the short term.
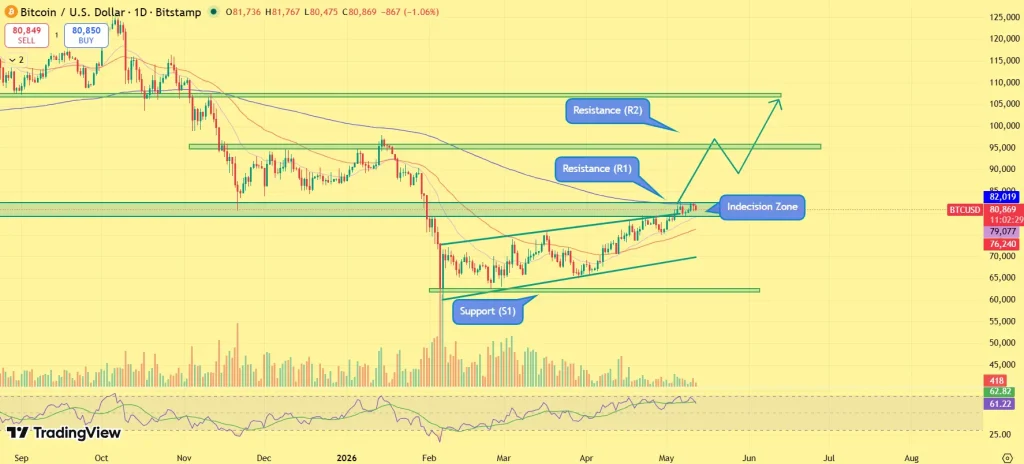
The $82,000 region now acts as the most important breakout level on the chart. A decisive daily close above this zone could open the door for a rapid move toward the first resistance target near $94,000, followed by a larger rally toward the psychological $100,000-$110,000 range.
On the downside, failure to break above resistance may trigger a short-term correction toward the $76,000 support area, with deeper liquidity zones positioned near $73,000 and $70,000. These levels remain important because they previously acted as major accumulation regions during Bitcoin’s recovery rally. Overall, Bitcoin remains technically constructive, but the next breakout attempt near $82,500 will likely determine the market’s next major directional move.
What’s Next for Bitcoin (BTC)
Bitcoin’s current setup reflects a market entering one of its most important technical moments of the year. Miner selling activity, rising leverage exposure, and weakening breakout momentum are creating visible short-term pressure, while institutional demand and improving long-term adoption trends continue supporting the broader bullish structure.
For now, the $82,000 region remains the key level to watch. A decisive breakout above it could trigger renewed momentum toward six-figure territory, while another rejection may force Bitcoin into a larger reset phase before the next major expansion cycle begins.


추천 콘텐츠

Solana PreStocks Fall After Anthropic and OpenAI Alerts

MoneyGram Taps Stablecoins To Shield Colombians From Peso Weakness