

Tesla Stock stalls near 412 pivot as intraday momentum fades

Tesla Stock remains in a daily uptrend, but momentum faded into the close. Price settled at 409.99, just under the 412 daily pivot. The setup favors consolidation above support rather than a clean breakout today.
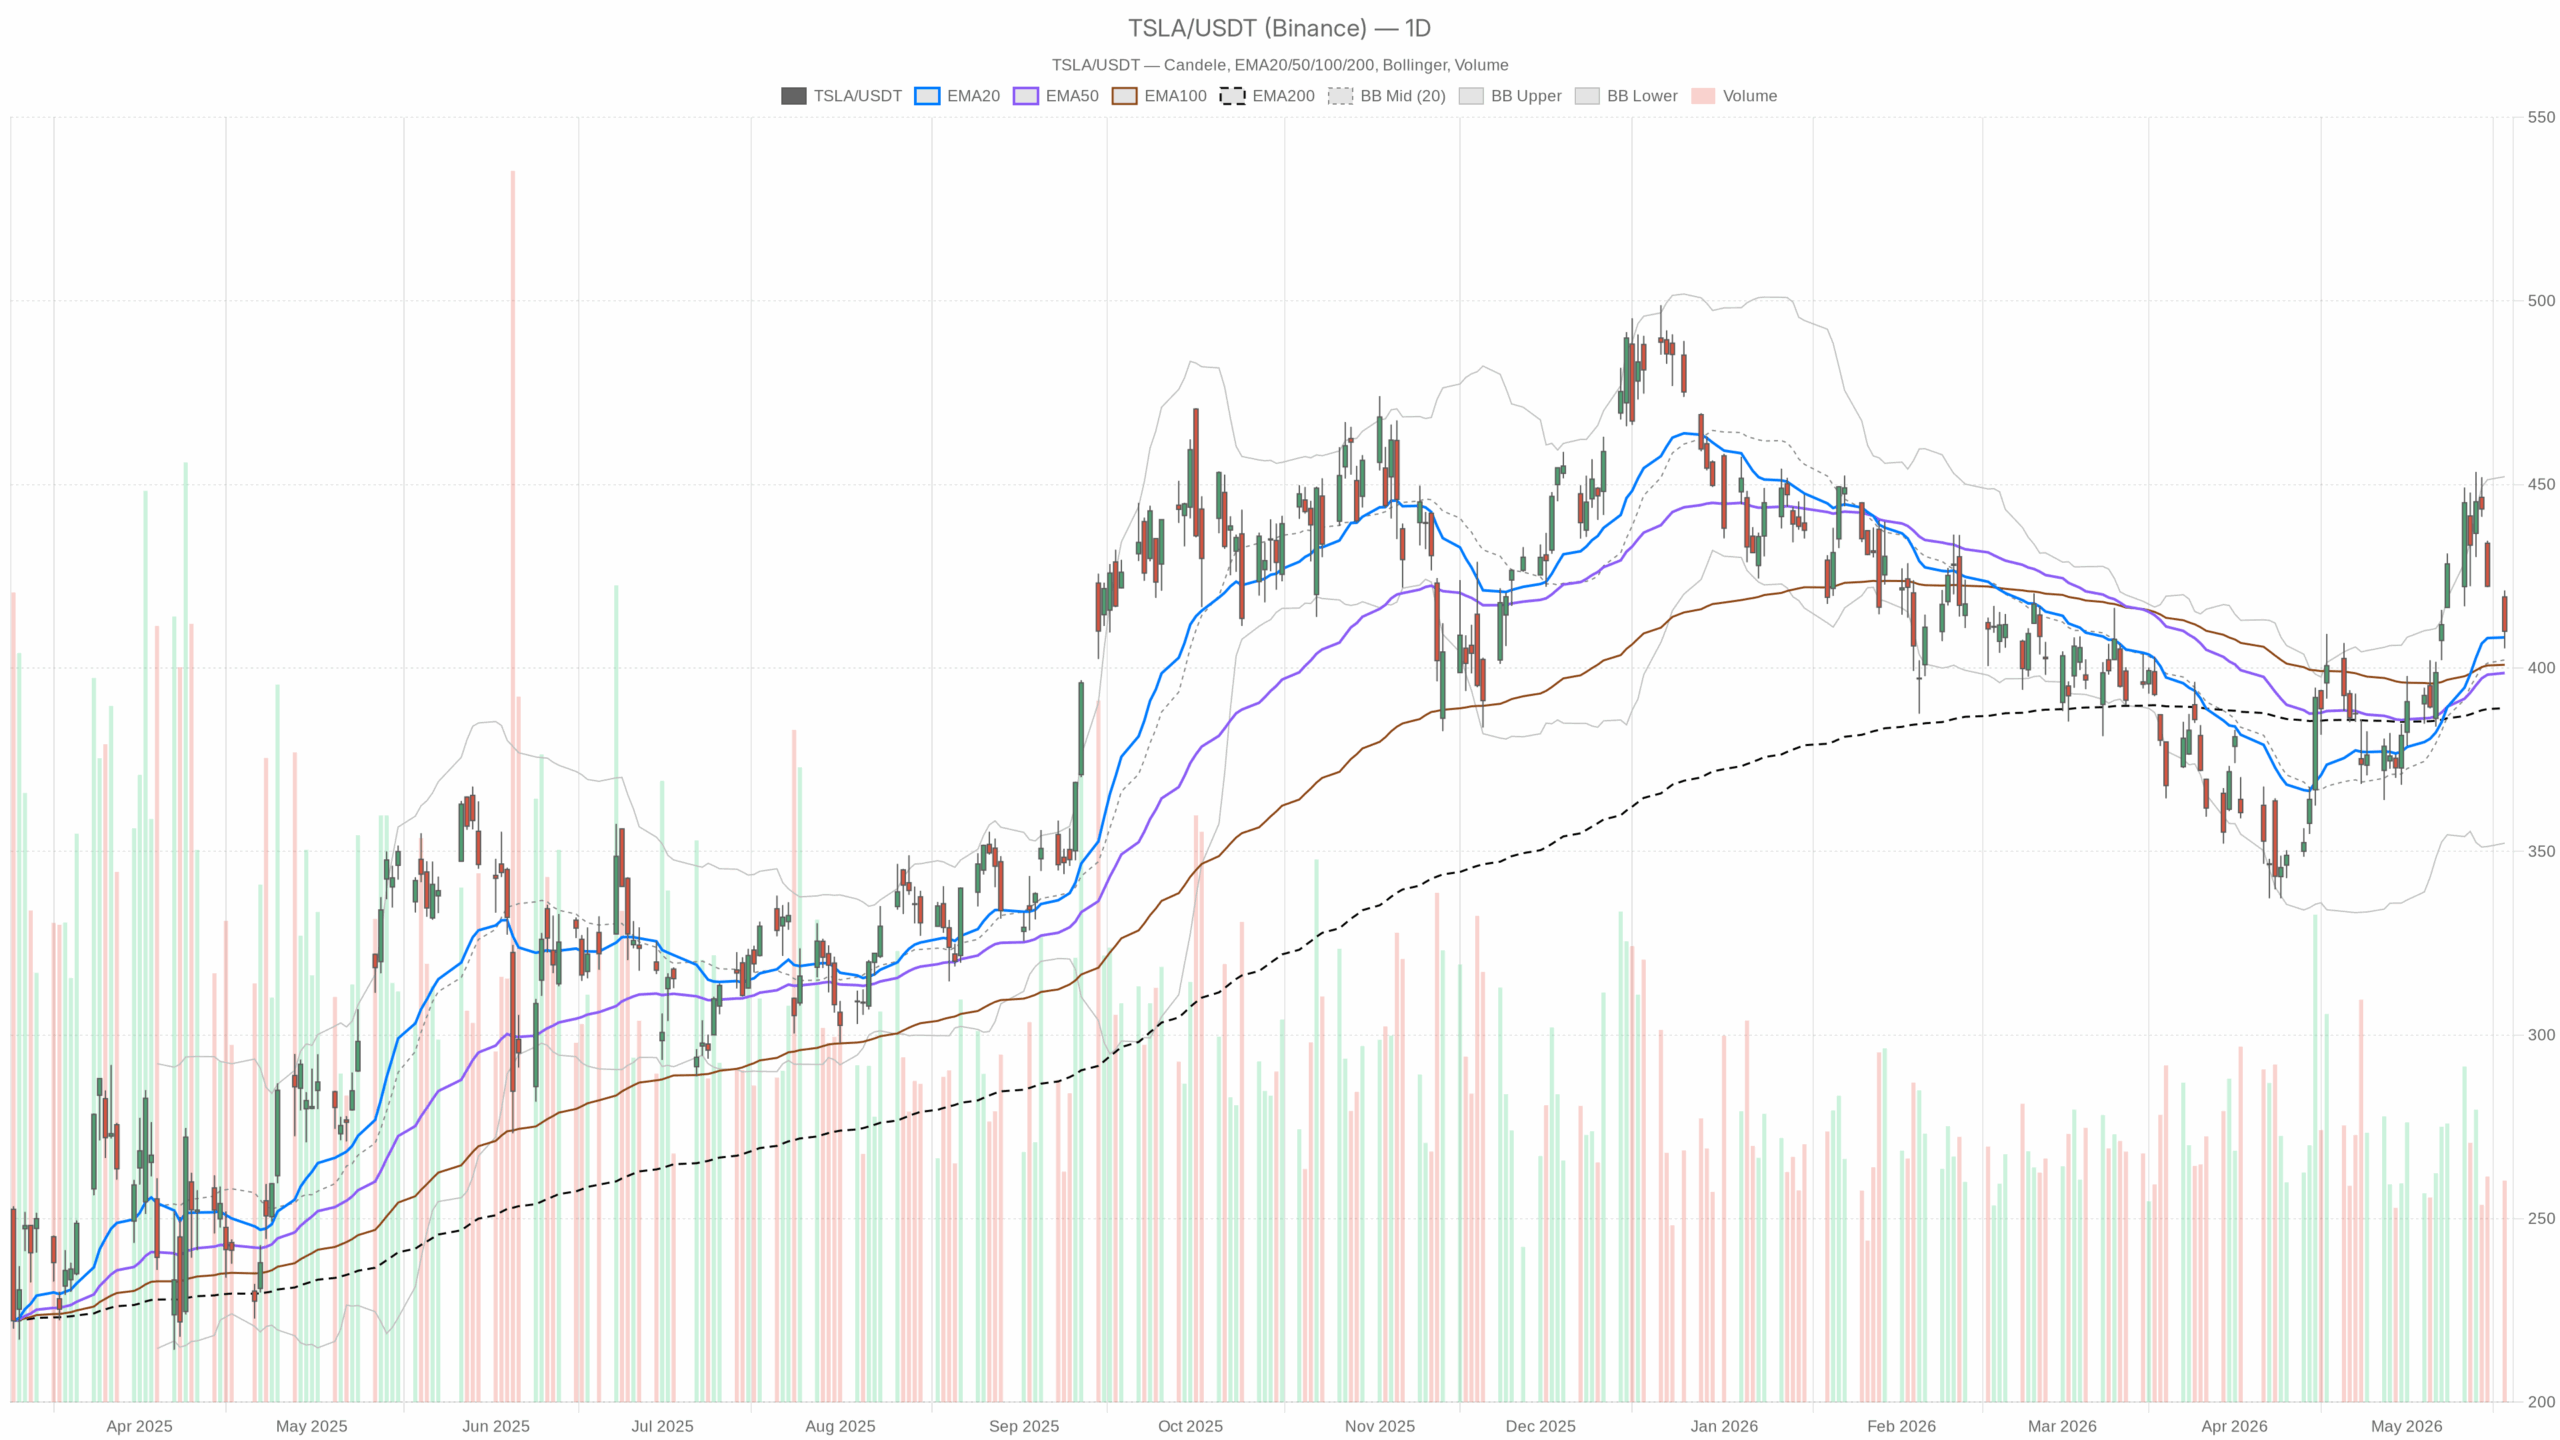 TSLA — daily chart with candlesticks, EMA20/EMA50 and volume.
Tesla Stock Daily Uptrend: Key Levels and Momentum
On the daily timeframe, TSLA trades above its EMA20 408.32, EMA50 398.63, and EMA200 389.03. Trading above all three keeps the primary trend bullish. RSI14 52.68 shows positive, not stretched, momentum. MACD 13.49 sits above the 11.28 signal with a +2.21 histogram. The impulse is bullish, yet its size argues for a modest push.
Meanwhile, the Bollinger mid-band stands at 402.19 with bands near 452.12 and 352.27. Price near the mid-band indicates mid-range positioning within a wide envelope. ATR14 17.8 keeps daily swings elevated and can shake weak hands. Price closed just below the daily pivot around 412–412.15, with R1 418.97 and S1 403.17. Sellers showed up near 412, and those levels frame today’s risk.
1H Intraday Bias: Soft Momentum Within Broader Uptrend
However, the 1H chart weakens the bullish tone. Price at 410.07 sits below the EMA20 421.15 and EMA50 423.23, while above the EMA200 401.66. The short-term trend is down inside a larger uptrend. RSI14 33.1 is weak and near oversold. MACD -7.28 is below its -5.00 signal with a -2.28 histogram.
In contrast, Bollinger metrics keep the bias defensive. The mid sits at 425.71 with a lower band near 396.90. Trading in the lower half shows sellers retain control intraday. ATR14 5.92 implies wider-than-usual hourly ranges. Price hovers around the hourly pivot at 409.76, with R1 411.28 and S1 408.56. These micro levels define the next short swing.
15-Minute Stabilization Around 409–410
Meanwhile, the 15-minute tape is trying to stabilize. Price at 410.07 sits near the EMA20 410.65 but remains below the EMA50 417.77 and EMA200 423.66. The micro trend is still bearish, yet stabilization is underway. RSI14 43.87 is recovering toward neutral, showing early balancing rather than exhaustion.
Notably, MACD -2.79 is below the -3.60 signal, but the +0.81 histogram has flipped positive. Short-term momentum is improving. The Bollinger mid is 409.46 with price just above it, reflecting a tentative base forming at 409–410. ATR14 2.32 keeps near-term noise contained. Price is nudging the 15-minute pivot at 409.97, with R1 411.07 and S1 408.98. Buyers are trying to defend the 410 handle.
Headlines and Flows Shaping Tesla Stock
Notably, headlines are a headwind. Coverage of a potential SpaceX IPO suggests the “Muskonomy” premium could fragment, introducing a valuation overhang for Tesla Stock. At the same time, Tesla raised U.S. Model Y prices for the first time since 2024. Pricing power can aid margins, yet it may not move the needle alone. Additionally, TSLA’s heavy weight in consumer discretionary ETFs can amplify flows.
Bullish Confirmation Path Above 412, Then 418–423
Therefore, the bullish case remains the base scenario while the daily structure holds. A push back above 412 (daily pivot) and then 418.97 (R1), followed by 421–423 (the hourly EMA cluster), would confirm momentum re-acceleration. Clearing those layers would put buyers back in control. On the daily chart, RSI holding above 50 and a firming MACD histogram would corroborate the move. With ATR14 17.8, follow-through can be brisk once resistance breaks. Positioning must respect the speed.
Bearish Risk Path Below 408–410, Then 403–398
On the other hand, failure to hold 408–410 and a break of 403.17 (S1) would hand the initiative to sellers. A daily slip below the 402 mid-Bollinger and the hourly EMA200 401.66 would likely target the daily EMA50 398.63. Losing the EMA50 would invalidate the current bullish bias. Intraday, a sustained RSI drop back toward the 30s with a deeper negative MACD would confirm control shifting to bears. That would argue for patience on longs.
Outlook for Tesla Stock: Range Until a Break
Overall, Tesla Stock carries a bullish daily bias restrained by soft intraday momentum and a noisy news stream. Volatility is elevated, so level-by-level confirmation matters. Watch 403 on the downside and 418–423 on the upside to resolve the stalemate. Until those break, expect range trading around the 408–412 band. Uncertainty around the “Muskonomy” narrative and pricing actions keeps conviction in check.


추천 콘텐츠

ASML (ASML) Stock: High-NA EUV Chips Expected Within Months Despite TSMC Pricing Concerns

Financial Markets on Edge as Inflation and Energy Concerns Persist


