

Nvidia Stock Holds Uptrend as Momentum Softens Ahead of Earnings

Nvidia Stock holds a constructive daily uptrend, while intraday momentum softens into earnings. The primary bias stays bullish on the Daily chart, yet the Hourly tone is cautious, creating a modest tug-of-war around near-term pivots.
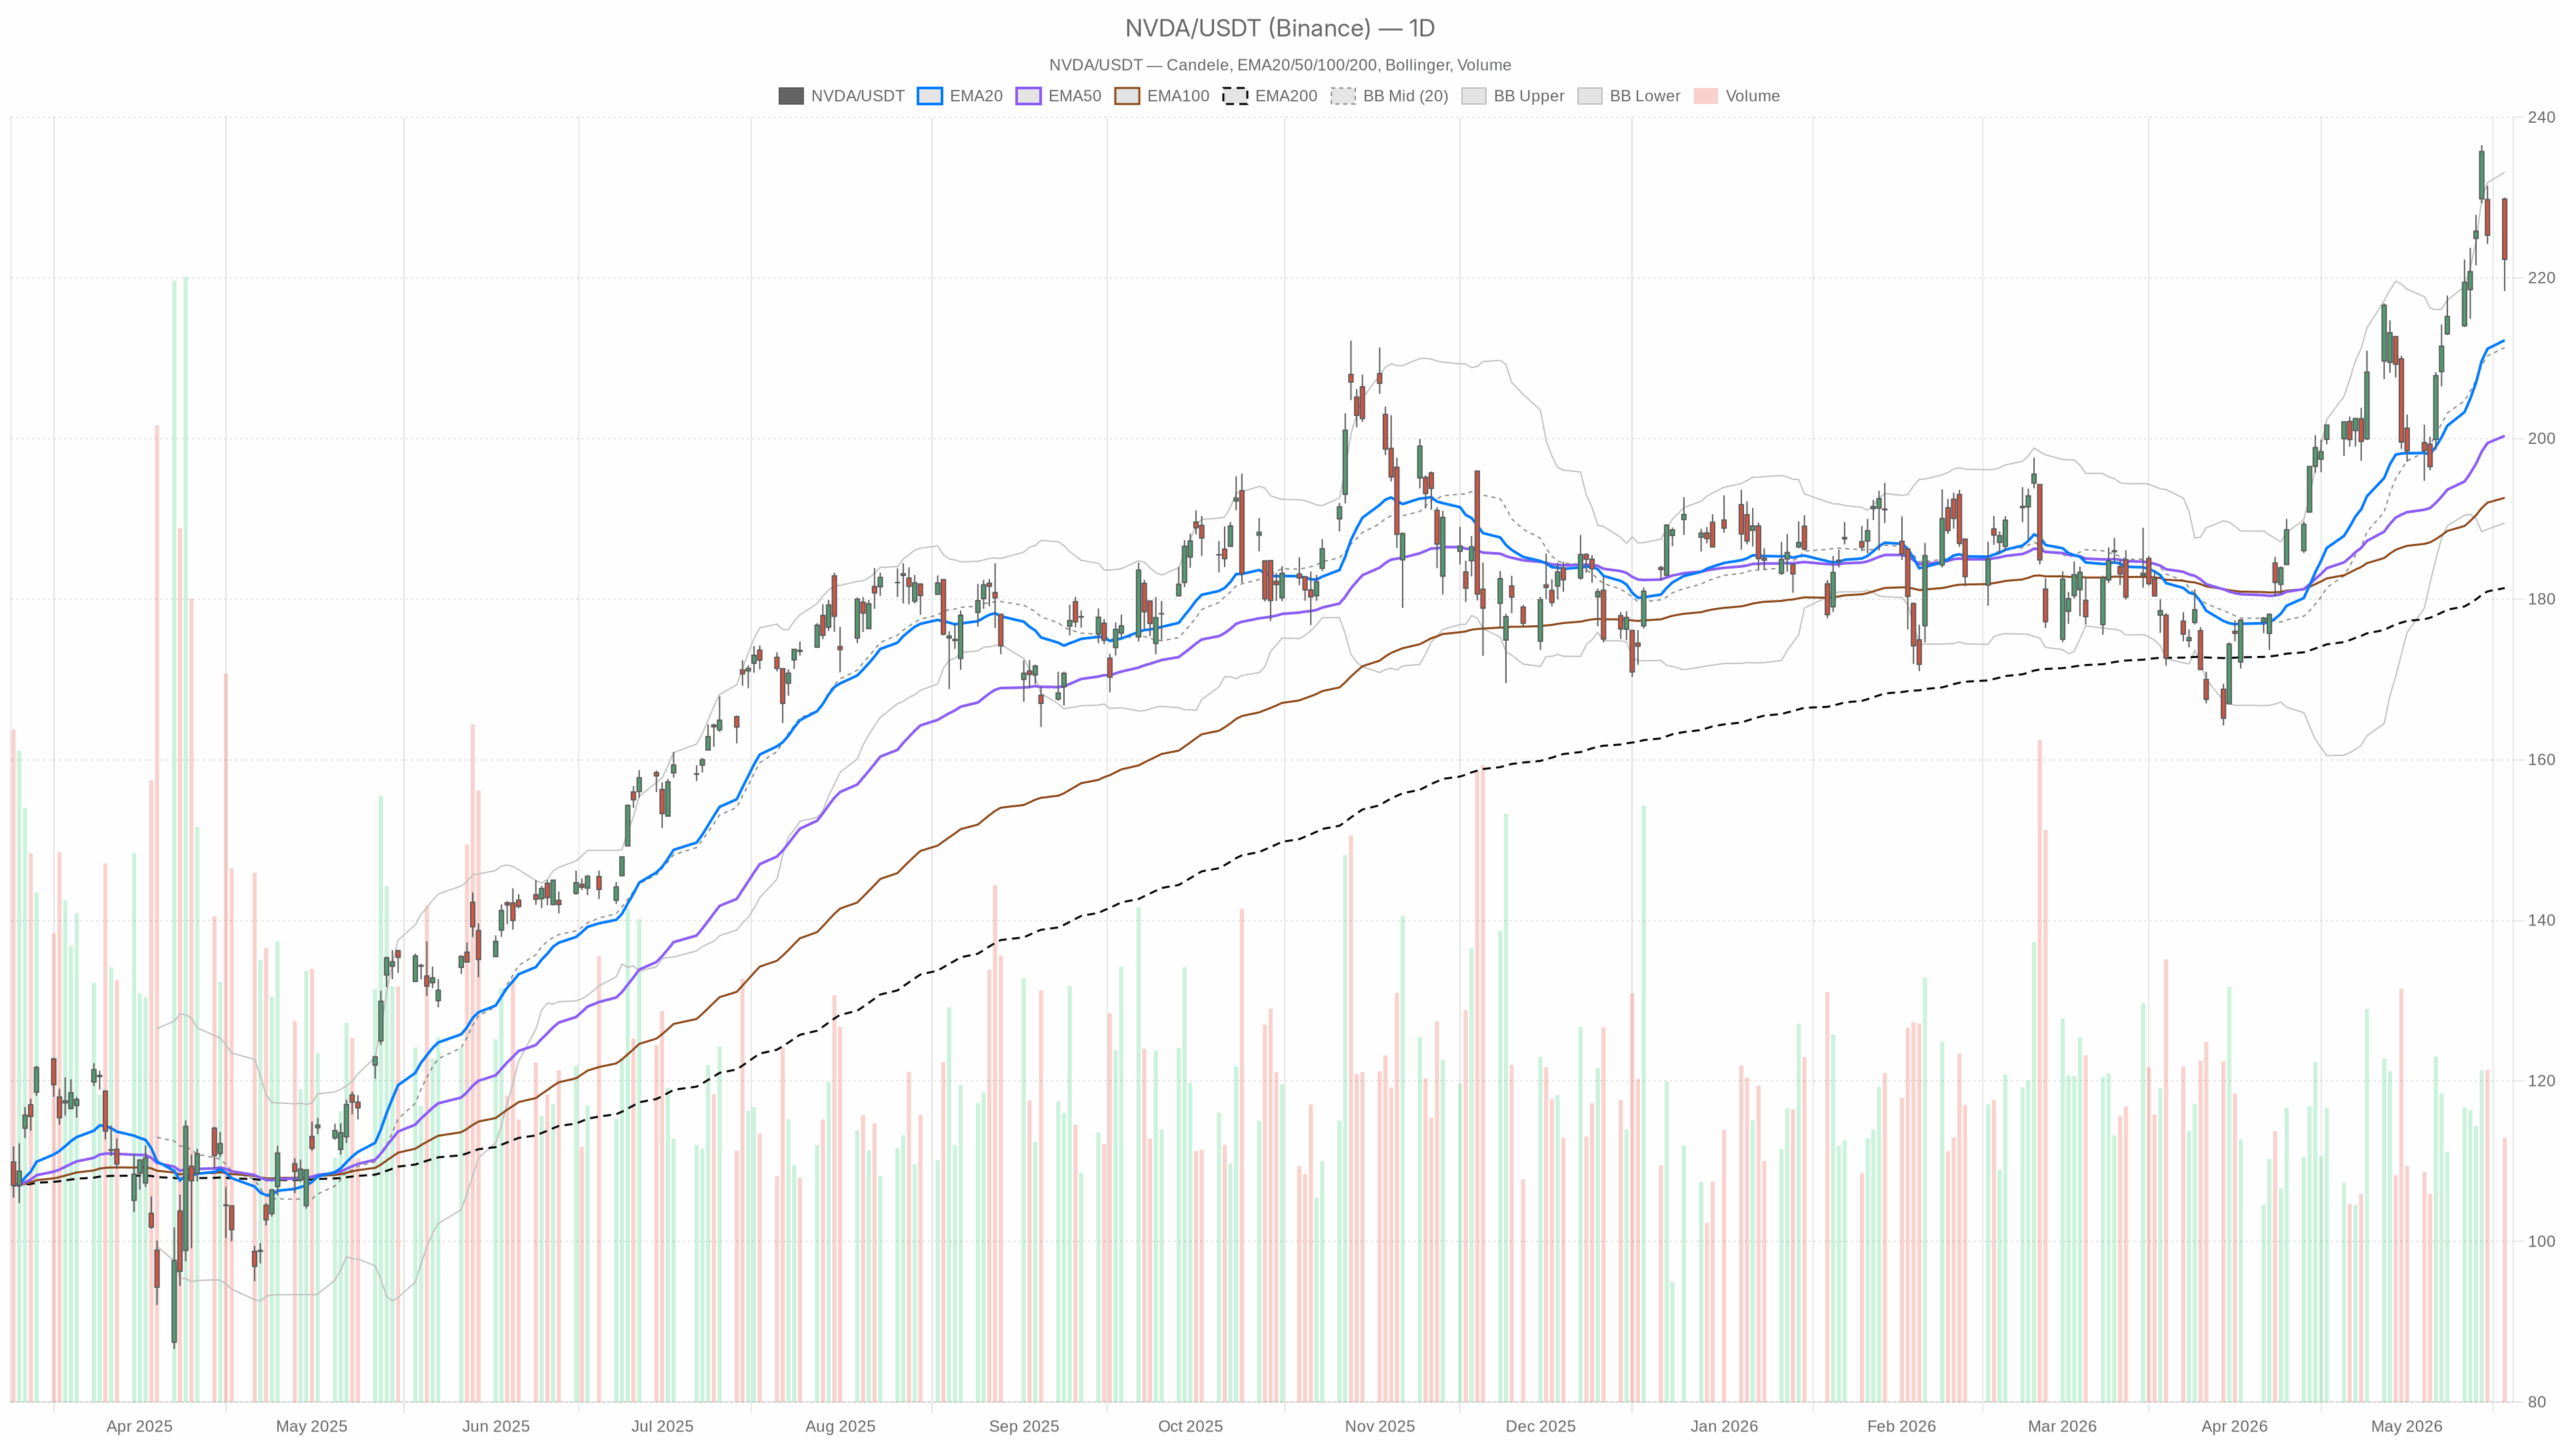 NVDA — daily chart with candlesticks, EMA20/EMA50 and volume.
Daily Chart: Nvidia Stock Uptrend Intact Into Earnings
Momentum and Trend Support
On the Daily timeframe, NVDA closed at 222.32, above the 20/50/200-day EMAs at 212.24/200.33/181.38. Therefore, layered trend support remains intact. Daily RSI(14) 61.66 shows positive momentum without overheating. Meanwhile, the MACD line is above the signal with a positive histogram near 1.26, indicating upside momentum that persists, though not surging.
Pivots, Bands, and Key Levels
Bollinger Bands center on 211.31, with the upper band near 233.15. Price sits in the upper half, leaving room toward resistance. Daily ATR(14) 8.44 flags elevated ranges into the event.
The Daily pivot is 223.56 with R1 228.76 and S1 217.13. Price finished just below the pivot, implying slight near‑term pressure inside a broader uptrend. Notably, Monday’s range rejected 230 and held 218.37. Supply appeared near round‑number resistance, while demand emerged above S1.
Immediate resistance is 223.56/228.76, the prior high at 230, and the upper band near 233.15. Upside likely needs fresh momentum to clear that cluster. Support layers sit at 217.13, the 20‑day EMA at 212.24, and the Bollinger mid at 211.31. A pullback into this area would test, not break, the trend on first touch.
Hourly Chart: Momentum Cools Within Broader Uptrend
EMAs, Oscillators, and Pivot Map
On the 1H chart, price is below the EMA20 224.61 and roughly in line with the EMA50 222.04, while the EMA200 207.31 still trails well below. This reflects a softer short‑term tone within a larger uptrend.
Hourly RSI(14) 44.62 leans mildly bearish. The MACD is negative with a falling histogram, keeping momentum tilted down. Meanwhile, the Bollinger mid on 1H sits near 227.68 with price in the lower half, suggesting mean‑reversion attempts face overhead gravity.
Hourly ATR(14) 3.6 indicates active intraday swings. The 1H pivot is 221.61 with R1 223.09 and S1 220.86. Price is marginally above the pivot and below R1, signaling a tentative bounce rather than a resolved trend.
15-Minute View: Micro Rebound, Mixed Structure
At the 15‑minute scale, price is above the EMA20 221.73 and the EMA200 221.38 but below the EMA50 224.18. This marks a micro‑bounce within a mixed short‑term structure.
RSI(14) near 49.69 is neutral. The MACD histogram is positive as the line sits just above the signal, hinting at a short‑term uptick. The Bollinger mid is 221.26 with price in the upper half. Therefore, near‑term pressure skews slightly upward.
The 15m pivot is 222.07 with R1 222.63 and S1 221.79. Price is testing between the pivot and R1. Accordingly, local resistance is close and meaningful for timing.
Earnings and Options Flow Context for Nvidia Stock
Positioning into earnings looks cautious. Options flow showed calls outpacing puts, yet many calls traded at the bid or below, implying supply from call sellers. Therefore, upside may be tactically capped into the event.
Earnings dominate this week’s narrative. History points to modest short‑term post‑earnings gains but stronger longer‑term outcomes. As a result, the near‑term reaction can be choppy regardless of the broader trend in Nvidia Stock.
NVDA Trading Scenarios: Bullish and Bearish Levels
Bullish scenario: A push back through the Daily pivot at 223.56 and the 1H EMA20 224.61 would reassert upside control. That opens 228.76–230 and, on extension, the upper band near 233.15. Confirmation would be 1H RSI pressing above 50 and a positive MACD cross, with price riding the 1H Bollinger mid or upper band.
Bearish scenario: On the other hand, failure below 223 with repeated rejections at 223–225 would hand control to sellers. A subsequent slip under the 1H pivot at 221.61 and S1 at 220.86 would confirm. A break of 217.13 exposes the 20‑day EMA at 212.24 and the Bollinger mid at 211.31. The bullish case is invalidated on a Daily close below the 20‑day EMA near 212.
Bottom Line: Bullish Anchor, Patience on Entries
Overall, the Daily uptrend remains the anchor, while Hourly softness argues for patience on entries until key intraday levels are reclaimed. Volatility is elevated into the print, as reflected by ATR and wider bands. Until earnings reset expectations, Nvidia Stock likely trades choppy inside defined pivots with a bullish tilt that needs fresh confirmation.


추천 콘텐츠

ASML (ASML) Stock: High-NA EUV Chips Expected Within Months Despite TSMC Pricing Concerns

Financial Markets on Edge as Inflation and Energy Concerns Persist


