

This Key Bitcoin Metric Suggests The Market Is Now Entering A Phase Of Calm
Once again, the Bitcoin price is gradually regaining upside momentum after its recent pullback, with many crypto analysts anticipating a move toward the pivotal $80,000 mark. Data from a key metric now shows that the BTC market is entering a cooling phase as volatility slowly subsides.
Bitcoin Ongoing Market Volatility Is Easing
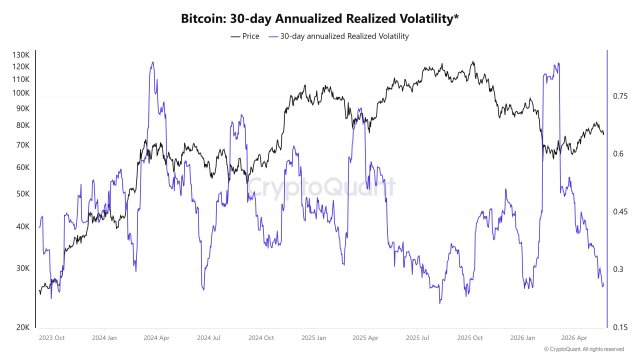
The Bitcoin market is currently witnessing a crucial shift in conditions as the BTC Annualized Realized Volatility Index flips back toward the downside. According to Arab Chain, a market expert and author at the CryptoQuant platform, this move points to a steady cool-down in market turbulence, along with BTC’s price trading near the $76,000 level.
Compared to earlier periods of extreme market fluctuations, Bitcoin’s price fluctuations are becoming less erratic, which may indicate a period of consolidation or stabilizing investor behavior. As seen in the 30-day chart, the key metric has dropped to around 0.26, which represents its lowest level since the beginning of 2026.
When the index reaches this level, it often indicates an environment of relative calm in market fluctuations, in contrast to previous times when there was significant volatility and abrupt price swings. Furthermore, the data shows that the market experienced repeated waves of heightened volatility over the past month, particularly in times of rallies or sharp corrections.
Previously, the metric saw a rise to levels exceeding 0.70 in some phases, which coincided with strong price movements. However, Arab Chain highlighted the recent gradual retreat in volatility, indicating that the market has transitioned into a phase of greater stability and relative calm.
When volatility is low, these periods are often associated with a state of anticipation in the market. Here, investors tend to limit their exposure to risks and await new catalysts that could push Bitcoin’s price into a clearer direction. In addition, sustained low volatility levels could be a sign of decreased liquidity and a decline in speculative activity relative to periods of strong activity.
While a drop in the volatility index is not inherently considered a bullish or bearish signal, markets typically experience strong movements following prolonged periods of calm. This is mostly evidenced when positions accumulate in a specific direction within the derivatives market. As a result, traders are keeping a close eye on this indicator in order to determine whether the market is likely to trigger a fresh wave of volatility in the coming period.
Fewer Investors Are Accumulating BTC
Given volatility across the market, Bitcoin investors are demonstrating cautious behavior as buying activity drops. Joao Wedson, the founder of Alphractal, has revealed that fewer wallet addresses are truly accumulating Bitcoin right now compared to 60 days ago.
During this phase, Michael Saylor’s Strategy has continued to acquire more BTC. However, the company’s accumulation is basically insignificant when compared to the scale of the entire Bitcoin blockchain. Wedson has noted that real accumulation often occurs in periods of extreme fear when the crowd is convinced that BTC is dead.


추천 콘텐츠

JIC Ventures backs Webout as it takes real-time video personalisation platform to the US

Exclusive interview with Smokey The Bera, co-founder of Berachain: How the innovative PoL public chain solves the liquidity problem and may be launched in a few months

Monster Beverage (MNST) Stock Hits 52-Week High After Strong Q1 Earnings


인기 뉴스
더보기
