

How Low Will Prices Drop Next? Surprising Trends & Predictions
After a sustained rally since November 2024, XRP has encountered significant resistance around the $3 mark, repeatedly attempting to break higher only to falter and retract. As the token tests crucial support levels, traders are scrutinizing technical signals that suggest a potential downturn. With the cryptocurrency market remaining highly volatile, understanding the possible risks and key levels is vital for investors keeping an eye on XRP’s next moves amidst broader crypto market volatility and evolving regulation landscapes.
- XRP has repeatedly tested the $3 resistance but failed to establish a sustained breakout, prompting fears of a deeper correction.
- A bearish fractal indicates a possible 15% decline toward $2.60, echoing similar patterns seen earlier this year.
- Technical indicators, including the RSI, suggest XRP’s momentum may be waning as it corrects from overbought levels.
- Liquidity data reveals significant long liquidation zones that could accelerate a sell-off if breached.
- The crucial support levels are near $2.93 and $2.52, with a close below $3 potentially triggering a cascade of liquidations leading to a sharper decline.
XRP chart fractal suggests potential 15% correction
XRP is currently mimicking a bearish fractal pattern that could lead to a notable decline. Since its surge past $3 in October, XRP has repeatedly challenged that level but has yet to sustain a breakout. The recent price action shows a formation of a rounded top, followed by consolidation within a bearish flag pattern on the four-hour chart—an archetype often signaling further declines.
This setup points toward a potential drop of up to 15%, aiming for the $2.60 level, near the 200-day exponential moving average (EMA). The current RSI, which has been correcting from overbought territory above 70, provides further confirmation that XRP may be ripe for a downtrend before any rebound.
In the short-term, XRP could test the flag support around $2.93. A decisive close below this level would validate the bearish scenario, increasing the likelihood of a move down to $2.60—the next significant support zone aligned with the 200-day EMA.
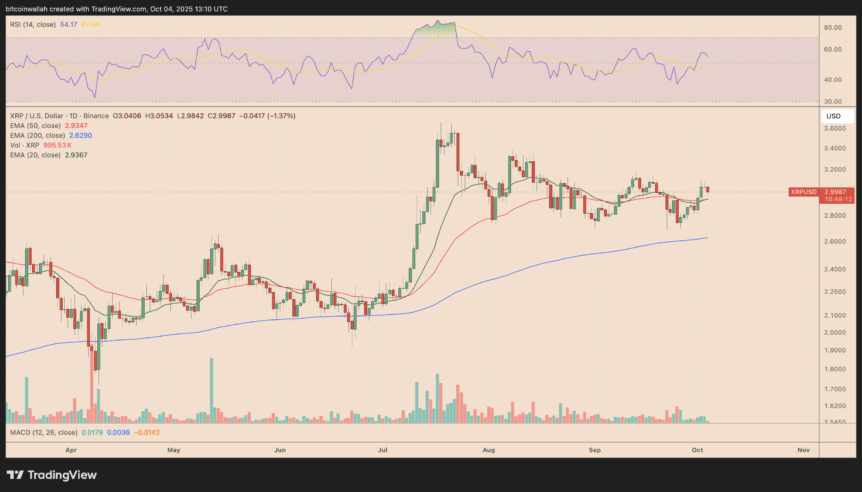 XRP/USD daily price chart. Source: TradingView
Conversely, a bounce from the current levels or the EMAs at $2.93 and $2.52 might invalidate the bearish outlook, potentially prompting a quick return to breakeven or above the $3 mark.
Liquidity levels warn of a potential sell-off risk
Data from CoinGlass indicates substantial liquidity concentrations at key levels, highlighting the risk of sharp price movements. Notably, XRP’s $3 support region sits between two major liquidity zones: a cluster of long liquidation points around $3.18 to $3.40 and a larger concentration of over $500 million in liquidations between $2.73 and $2.89.
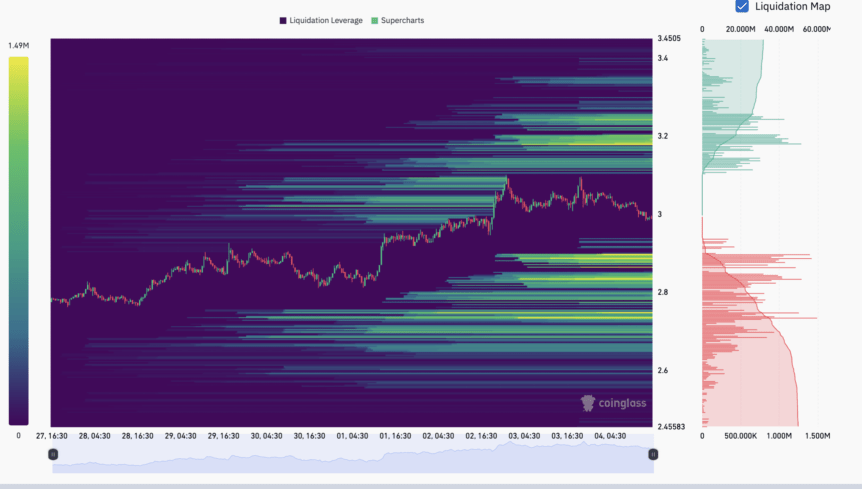 XRP/USDT liquidation heatmap (1-week). Source: CoinGlass/HyperLiquid
If XRP drops below $3, a cascade of long liquidations could accelerate toward the $2.89–$2.73 range, intensifying the downward trend. Conversely, if bulls defend the $3 level, it could trigger a short-term stop-run towards the $3.20–$3.40 area, where additional liquidations might occur.
This analysis does not constitute financial advice. Cryptocurrency investing is highly speculative, and traders should conduct thorough research before making any decisions.
This article was originally published as How Low Will Prices Drop Next? Surprising Trends & Predictions on Crypto Breaking News – your trusted source for crypto news, Bitcoin news, and blockchain updates.


추천 콘텐츠

BTC Price Analysis: Why Bitcoin Could Sweep $64K Before Reversal

Bitcoin treasury sell-off accelerates as Riot, Bhutan, and public companies exit positions


