Is This the Perfect ETH Buy Zone? Watch This Level as Ethereum Price Dips by 4%
Ethereum (ETH) is trading at around $4,500 after falling 4% in the past 24 hours.
Despite the dip, analysts are watching as the price returns to a zone where buyers have previously shown interest. The current 7-day change is still positive, with ETH up 5% over the week.
ETH/BTC Pullback May Offer Opportunity
Michaël van de Poppe shared a weekly ETH/BTC chart showing a strong rally earlier this year. The pair moved up more than 140% from its low, topping out near 0.038. It is now trading close to 0.0365 and approaching a support area.
Van de Poppe marked the 0.0325 to 0.03 BTC range as a possible entry point. This zone was acting as a resistance in the past, and now sits near the 10-week moving average. He also pointed to lower support levels at 0.026, 0.0232, and 0.0194. The current pullback has happened on lower volume, which could suggest less selling pressure.
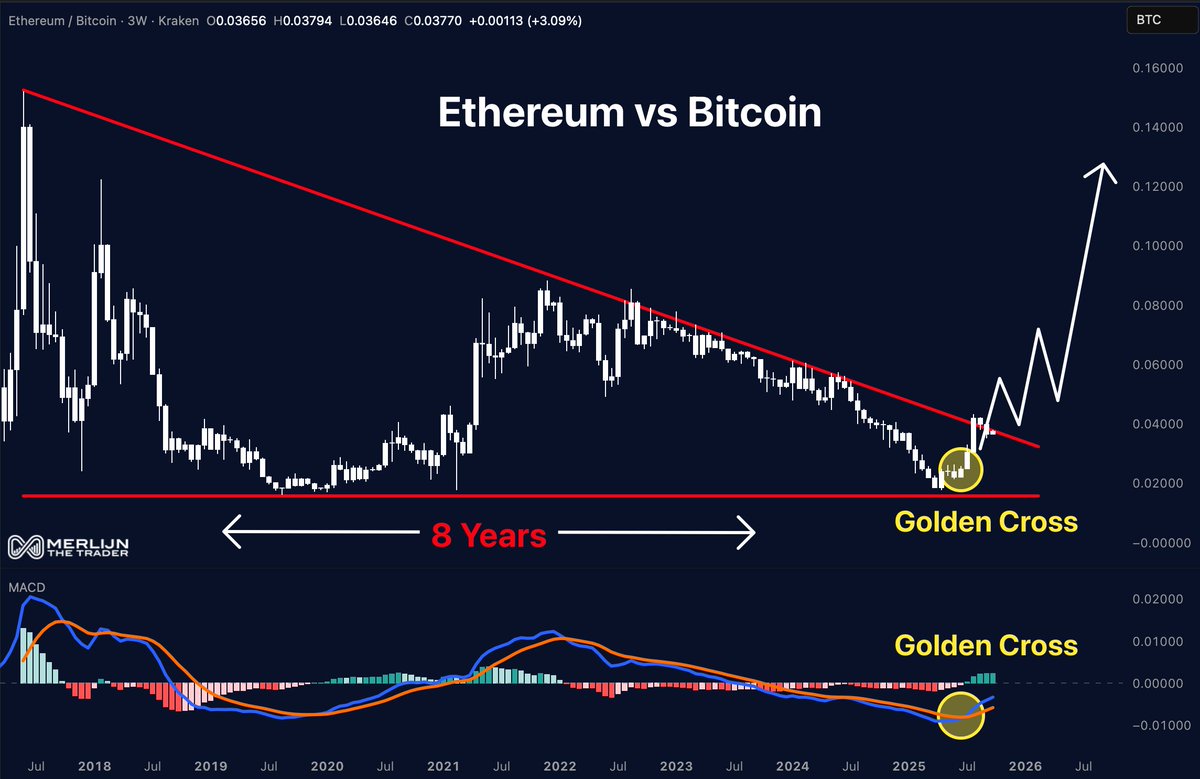
In addition, Merlijn The Trader posted a separate ETH/BTC chart showing a move above a trendline that held for eight years. The breakout came after ETH bounced off long-term support near 0.020. This change in structure may suggest a shift in momentum.
The chart also includes a golden cross on both price and MACD. This is the first time in years that momentum has flipped in favor of ETH on this chart.
His chart shows a path that could take ETH/BTC toward 0.10–0.12.
 Source: Merlijn The Trader/X
Daily Chart Shows Repeat Setup
On the daily chart, Trader Tardigrade posted a pattern that has repeated multiple times in recent months. In each case, ETH traded sideways, broke slightly below its support level, and then moved higher. These earlier setups resulted in rapid gains.
The latest move shows ETH pulling back below $4,600 before bouncing again. The pattern now suggests a possible move toward $5,800–$6,200. “Ethereum pump is ongoing,” he said, hinting that the structure may still be in play.
Key Zone Remains a Challenge
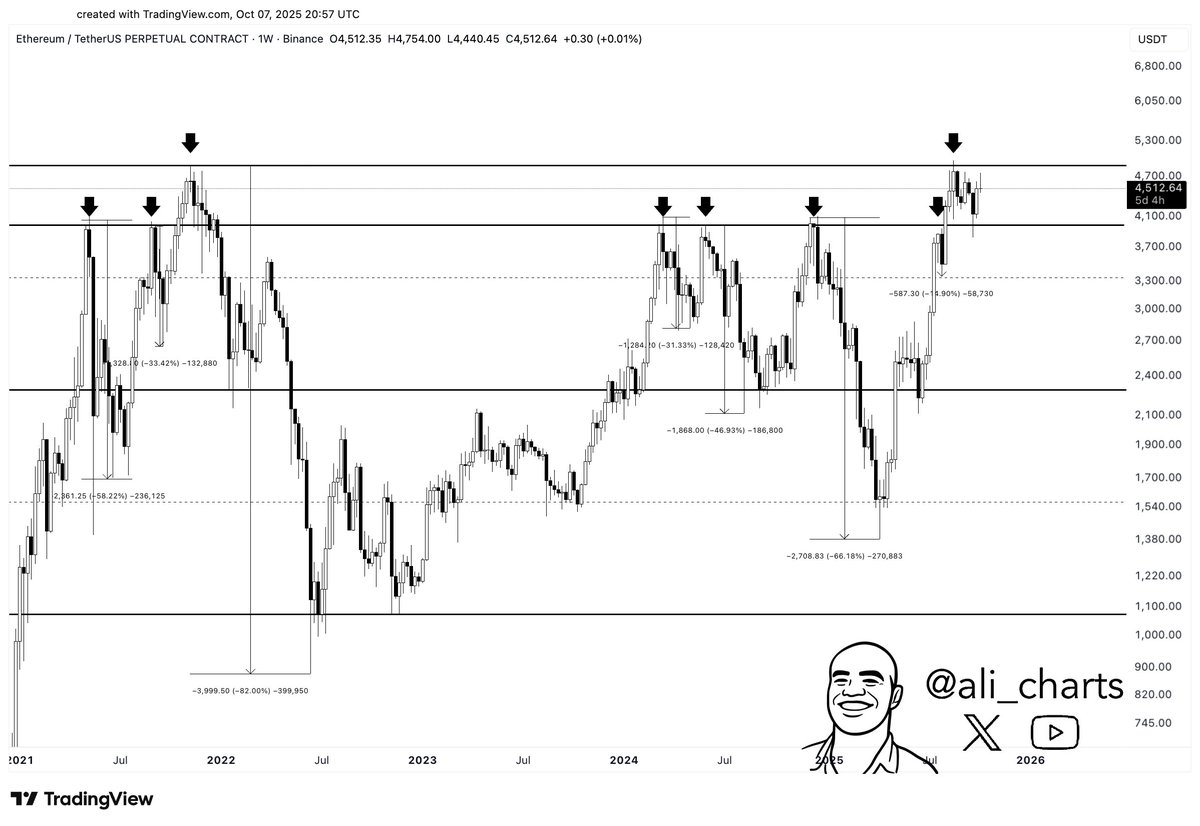
Ali Martinez has called the $4,000–$4,800 range Ethereum’s “danger zone” since 2021. His chart shows that ETH has failed at this level several times, often followed by sharp pullbacks. The past six rejections led to declines ranging from 31% to over 80%.
 Source: Ali Martinez/X
ETH is now back in that same zone, trading near $4,500. The chart marks this area as one to watch. “Every touch led to a correction,” Ali noted, suggesting caution as ETH tests this resistance once again.
The post Is This the Perfect ETH Buy Zone? Watch This Level as Ethereum Price Dips by 4% appeared first on CryptoPotato.


추천 콘텐츠

Solana Remains Above Its $75 Support Level

PMI-ACP Exam Preparation: How to Use a Simulator and Practice Questions Effectively