

XRP Reclaims Key Trendline: $14 to $28 Projections Ahead
XRP jumped over 7% in the past 24 hours, recovering from last week’s sharp drop. The asset moved from $2.37 to $2.59, adding roughly $30 billion to its market value.
Meanwhile, trading volume rose 17% to $9.6 billion as large buyers stepped in following a tariff-driven selloff.
Long-Term Pattern Suggests Higher Targets
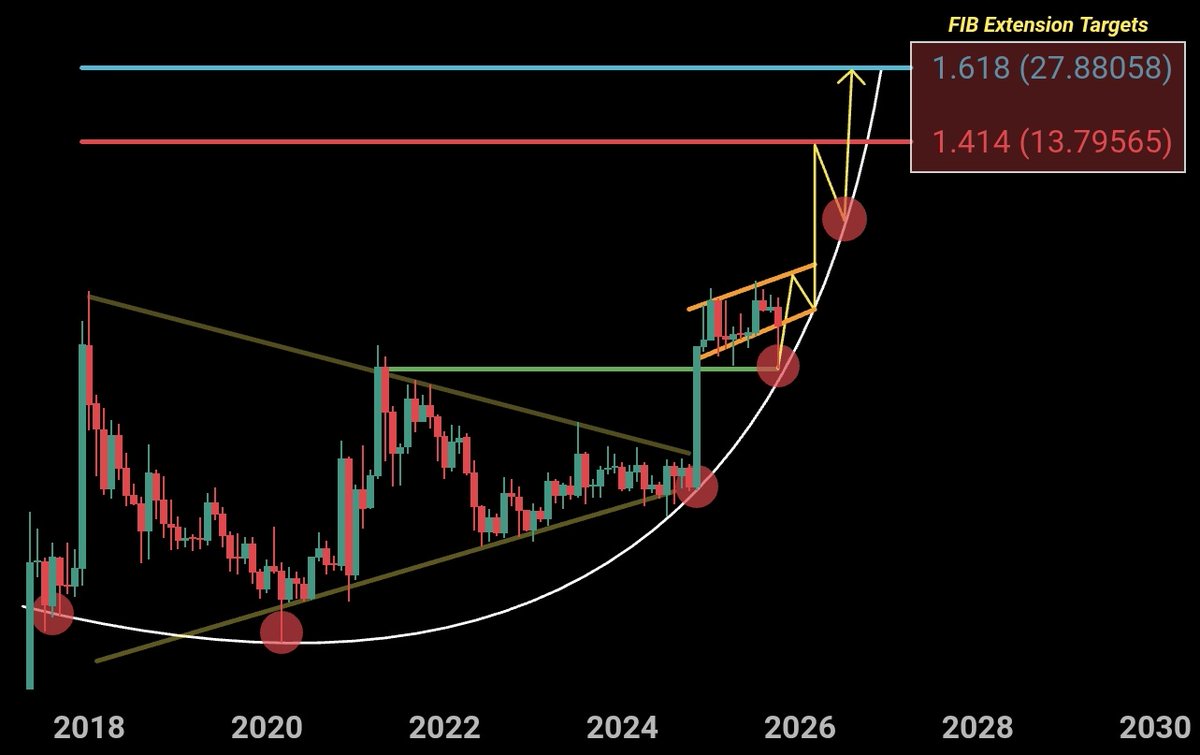
A chart shared by ChartNerd shows XRP breaking out of a multi-year triangle pattern, which began forming in 2018 and saw a clean breakout in late 2023. Since then, Ripple’s token has followed a curved support path, which has held across several key price levels.
Based on this structure, price projections are placed at $14 and $28. These targets come from commonly used Fibonacci extension levels (1.414 and 1.618).
 Source: ChartNerd/X
Notably, the chart also shows a flag forming in 2024–2025, which often acts as a pause before a trend continues. If the price moves above this flag, the path toward the higher targets could open up between 2026 and 2028.
Weekly Close Holds Above Trendline
XRP ended last week above a key rising trendline that has been in place since late 2024. This line has acted as support through several price swings.
CryptoBull commented,
The long lower wick on the candle suggests that buyers stepped in quickly after the drop. The strong bounce back and a rise in trading volume point to a possible shift in momentum.
Short-Term Chart Still Faces Resistance
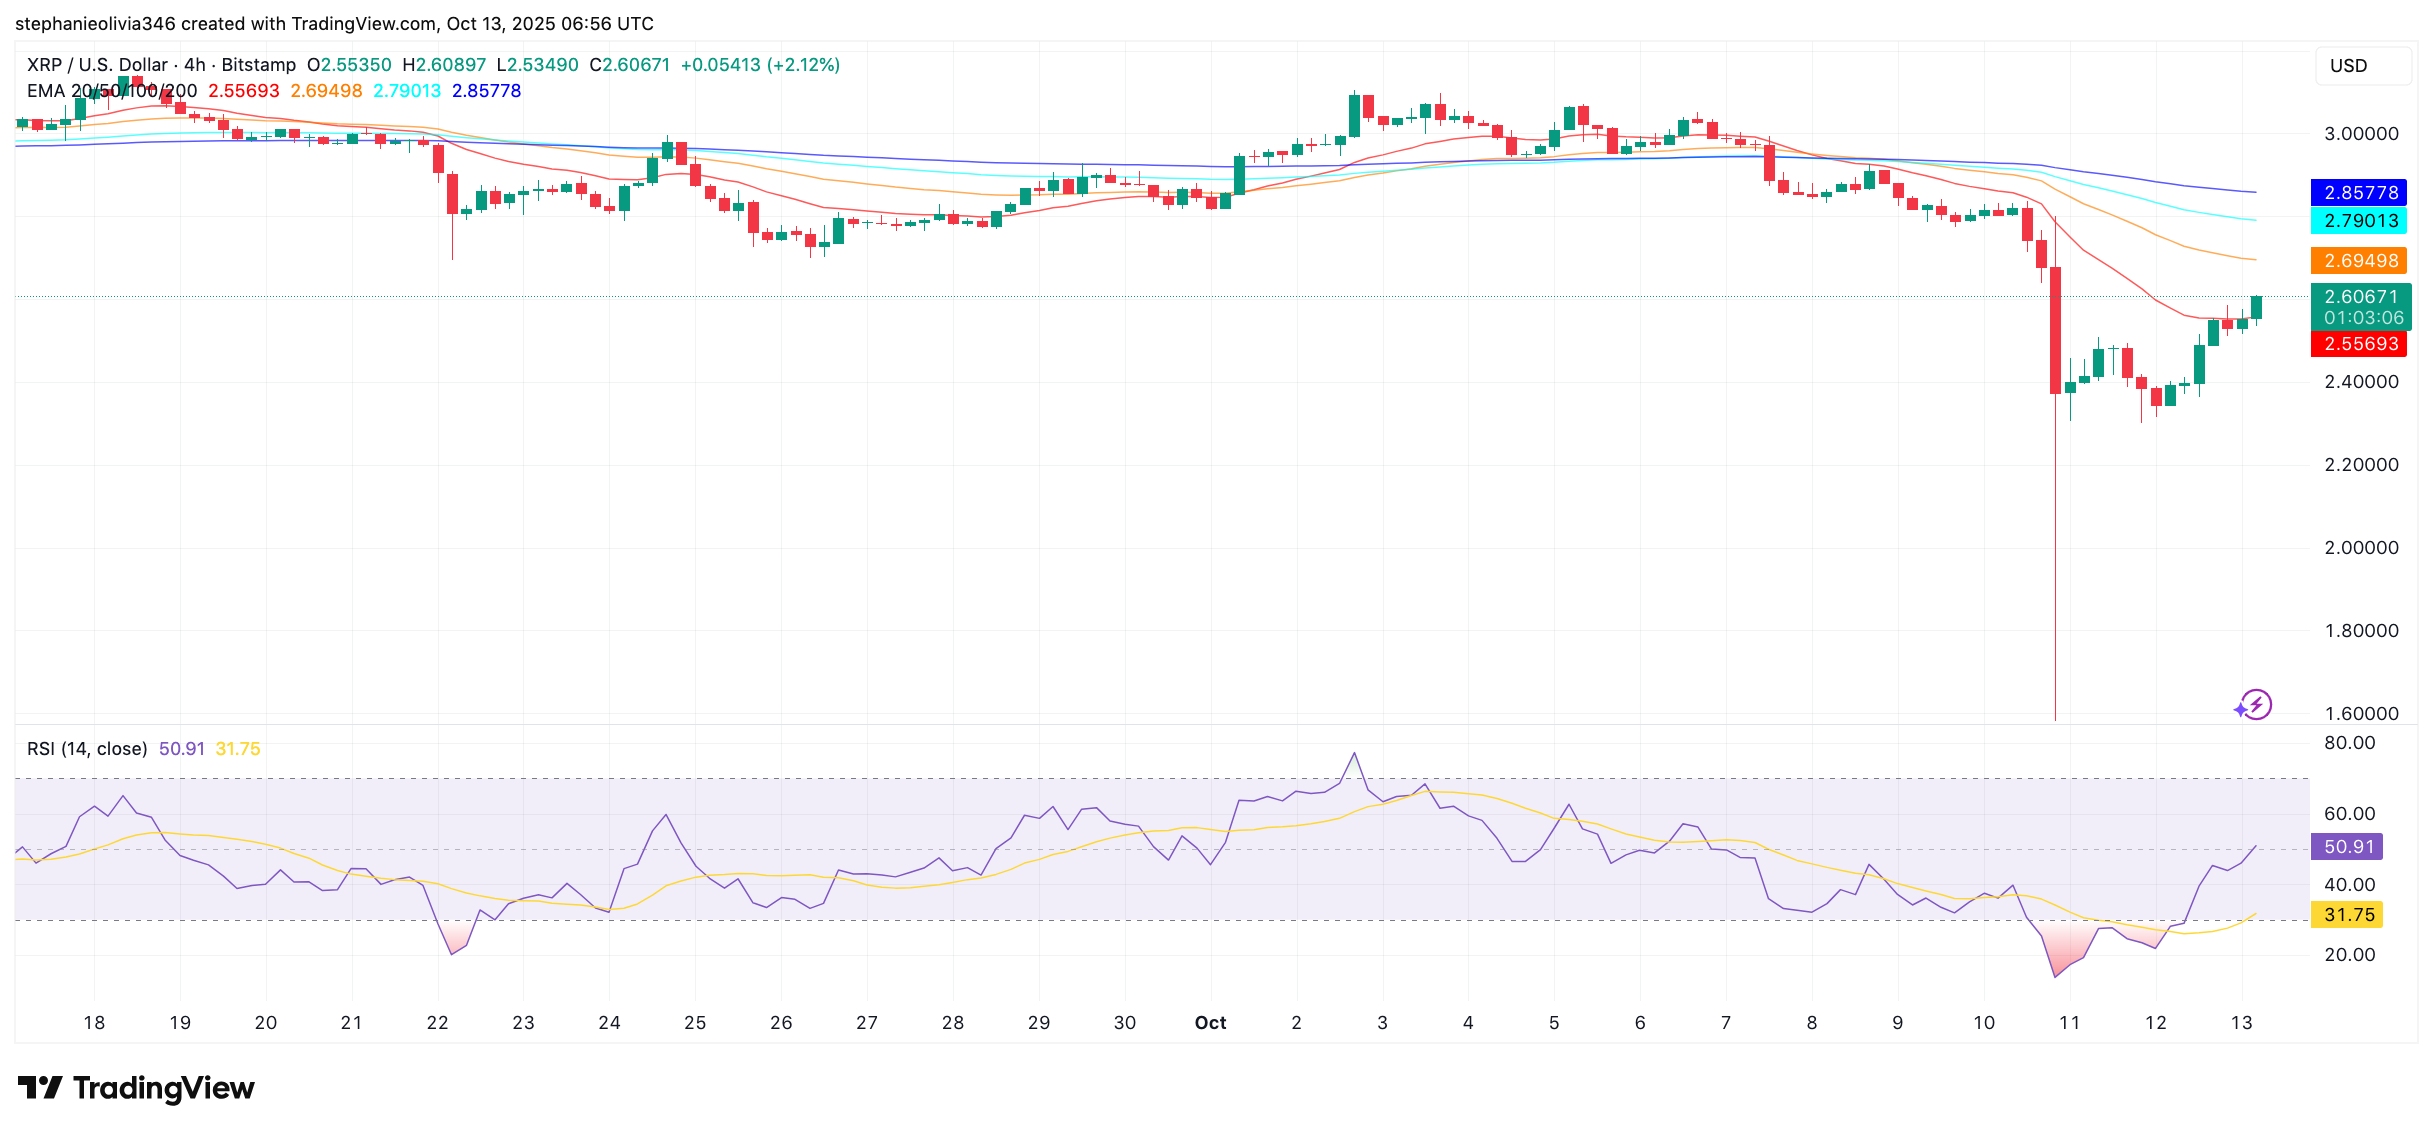
On the 4-hour chart, XRP has moved back above the 20 EMA, now sitting at $2.56. This shows early signs of strength after the recent selloff. The asset is now holding at around $2.60.
However, XRP still trades below the 50 EMA ($2.69), 100 EMA ($2.79), and 200 EMA ($2.86). These moving averages are often seen as short-term resistance. A clear move above them would signal a stronger recovery. Until that happens, caution remains in place.
 Source: TradingView
The Relative Strength Index (RSI) is presently near the 51 mark, which is an increase from a value below 30 given two days ago. The momentum is getting better as indicated by a value above 50.
The price staying above $2.60 has resulted in this bounce back of the RSI. In case XRP breaks resistance in the near future, the RSI might keep going up. For now, the trend is still unclear; however, the fast recovery has made the asset noticeable again.
The post XRP Reclaims Key Trendline: $14 to $28 Projections Ahead appeared first on CryptoPotato.


추천 콘텐츠
XRP Lands on SoFi as Bank Expands Crypto Access: What’s Next for Price?

WTI Oil eases to $87.50 amid a fragile US-Iran ceasefire


