

Dogecoin Shows ‘Huge Gap’ To $0.07: Is A Crash Imminent?
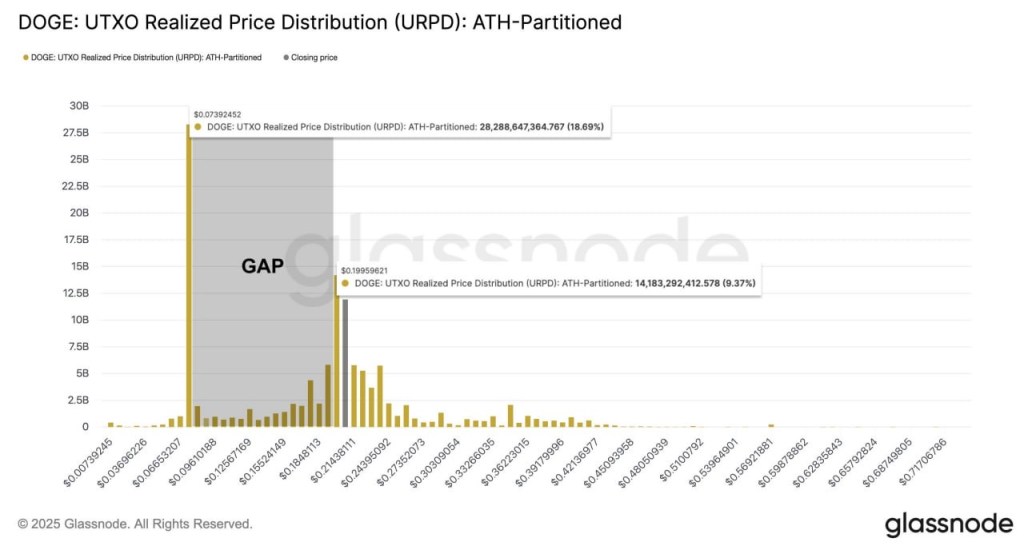
A widely watched on-chain profile for Dogecoin is flagging a striking absence of realized cost basis between roughly $0.19 and $0.07—an “air pocket” that could amplify volatility if price migrates into the range. Posting a Glassnode UTXO Realized Price Distribution (URPD): ATH-Partitioned chart, analyst NekoZ (@NekozTek) wrote: “There’s a huge gap on DOGE between $0.19 and $0.07.”
URPD maps coins by their last on-chain transfer price, a proxy for where current holders acquired their coins. Dense clusters typically align with strong support or resistance; sparsely populated bands imply fewer cost-anchored holders who might otherwise slow a move.
In the Dogecoin snapshot shared by NekoZ, the distribution shows two dominant shelves with relatively little realized supply between them. A large cohort sits near approximately $0.0739, labeled on the chart with 28,288,647,364.767 DOGE, equating to 18.69% of the measured supply.
Higher up, another notable node appears around $0.1996, carrying 14,183,292,412.578 DOGE, or 9.37%. The expanse shaded between these anchors is marked “GAP,” visually underscoring the thin realized supply across that corridor.
What Does That Mean For Dogecoin Price?
For traders, the structural message is straightforward but consequential. If spot price descends from the upper node into the underpopulated band, there are fewer holders with break-even incentives to absorb sell pressure, so downside can accelerate until it encounters the heavier cost basis around the lower cluster.
The logic is symmetrical on the way up: if price advances from the lower shelf into a sparsely held zone, there is less overhead supply to impede a rally until it nears the next dense pocket. URPD therefore speaks to path-dependence and market microstructure rather than direction in isolation.
The question embedded in the headline—whether a “crash” is imminent—cannot be answered by URPD alone. The distribution is not a timing tool and does not incorporate contemporaneous drivers such as order-book depth, derivatives positioning, or exogenous catalysts.
What it does show, with unusual clarity in Dogecoin’s case, is a bifurcated cost landscape: a heavy base near ~$0.07 and a sizable cluster near ~$0.20, with relatively little realized ownership in between. Should price traverse that interval, the chart implies a higher likelihood of fast travel within the gap and stickier behavior when it reconnects with one of the dense shelves.
NekoZ’s framing—“There’s a huge gap on DOGE between $0.19 and $0.07.”—captures the core risk. The Glassnode URPD snapshot quantifies it, highlighting that roughly one in five measured DOGE resides near ~$0.074 while close to one in ten sits near ~$0.20, bracketing a broad stretch of thin realized supply. For market participants, the takeaway is not a forecast, but a map: the route between those levels has fewer natural brakes.
At press time, DOGE traded at $0.198.


추천 콘텐츠

NZD/USD Surges: Kiwi Dollar Firms Near 0.5900 as Global Risk Appetite Returns

DRIFT Hacked: 280M$ Loss and Price Collapse


