Ethereum Price Analysis: Is $3.5K Next for ETH After 13% Weekly Drop?
Ethereum continues its correction phase after failing to maintain momentum above $4,200. The market’s sentiment remains cautious as ETH trades around $3,700, showing weakness both technically and sentiment-wise. Buyers are seemingly losing control, and the focus now shifts to key support zones below.
Technical Analysis
By Shayan
The Daily Chart
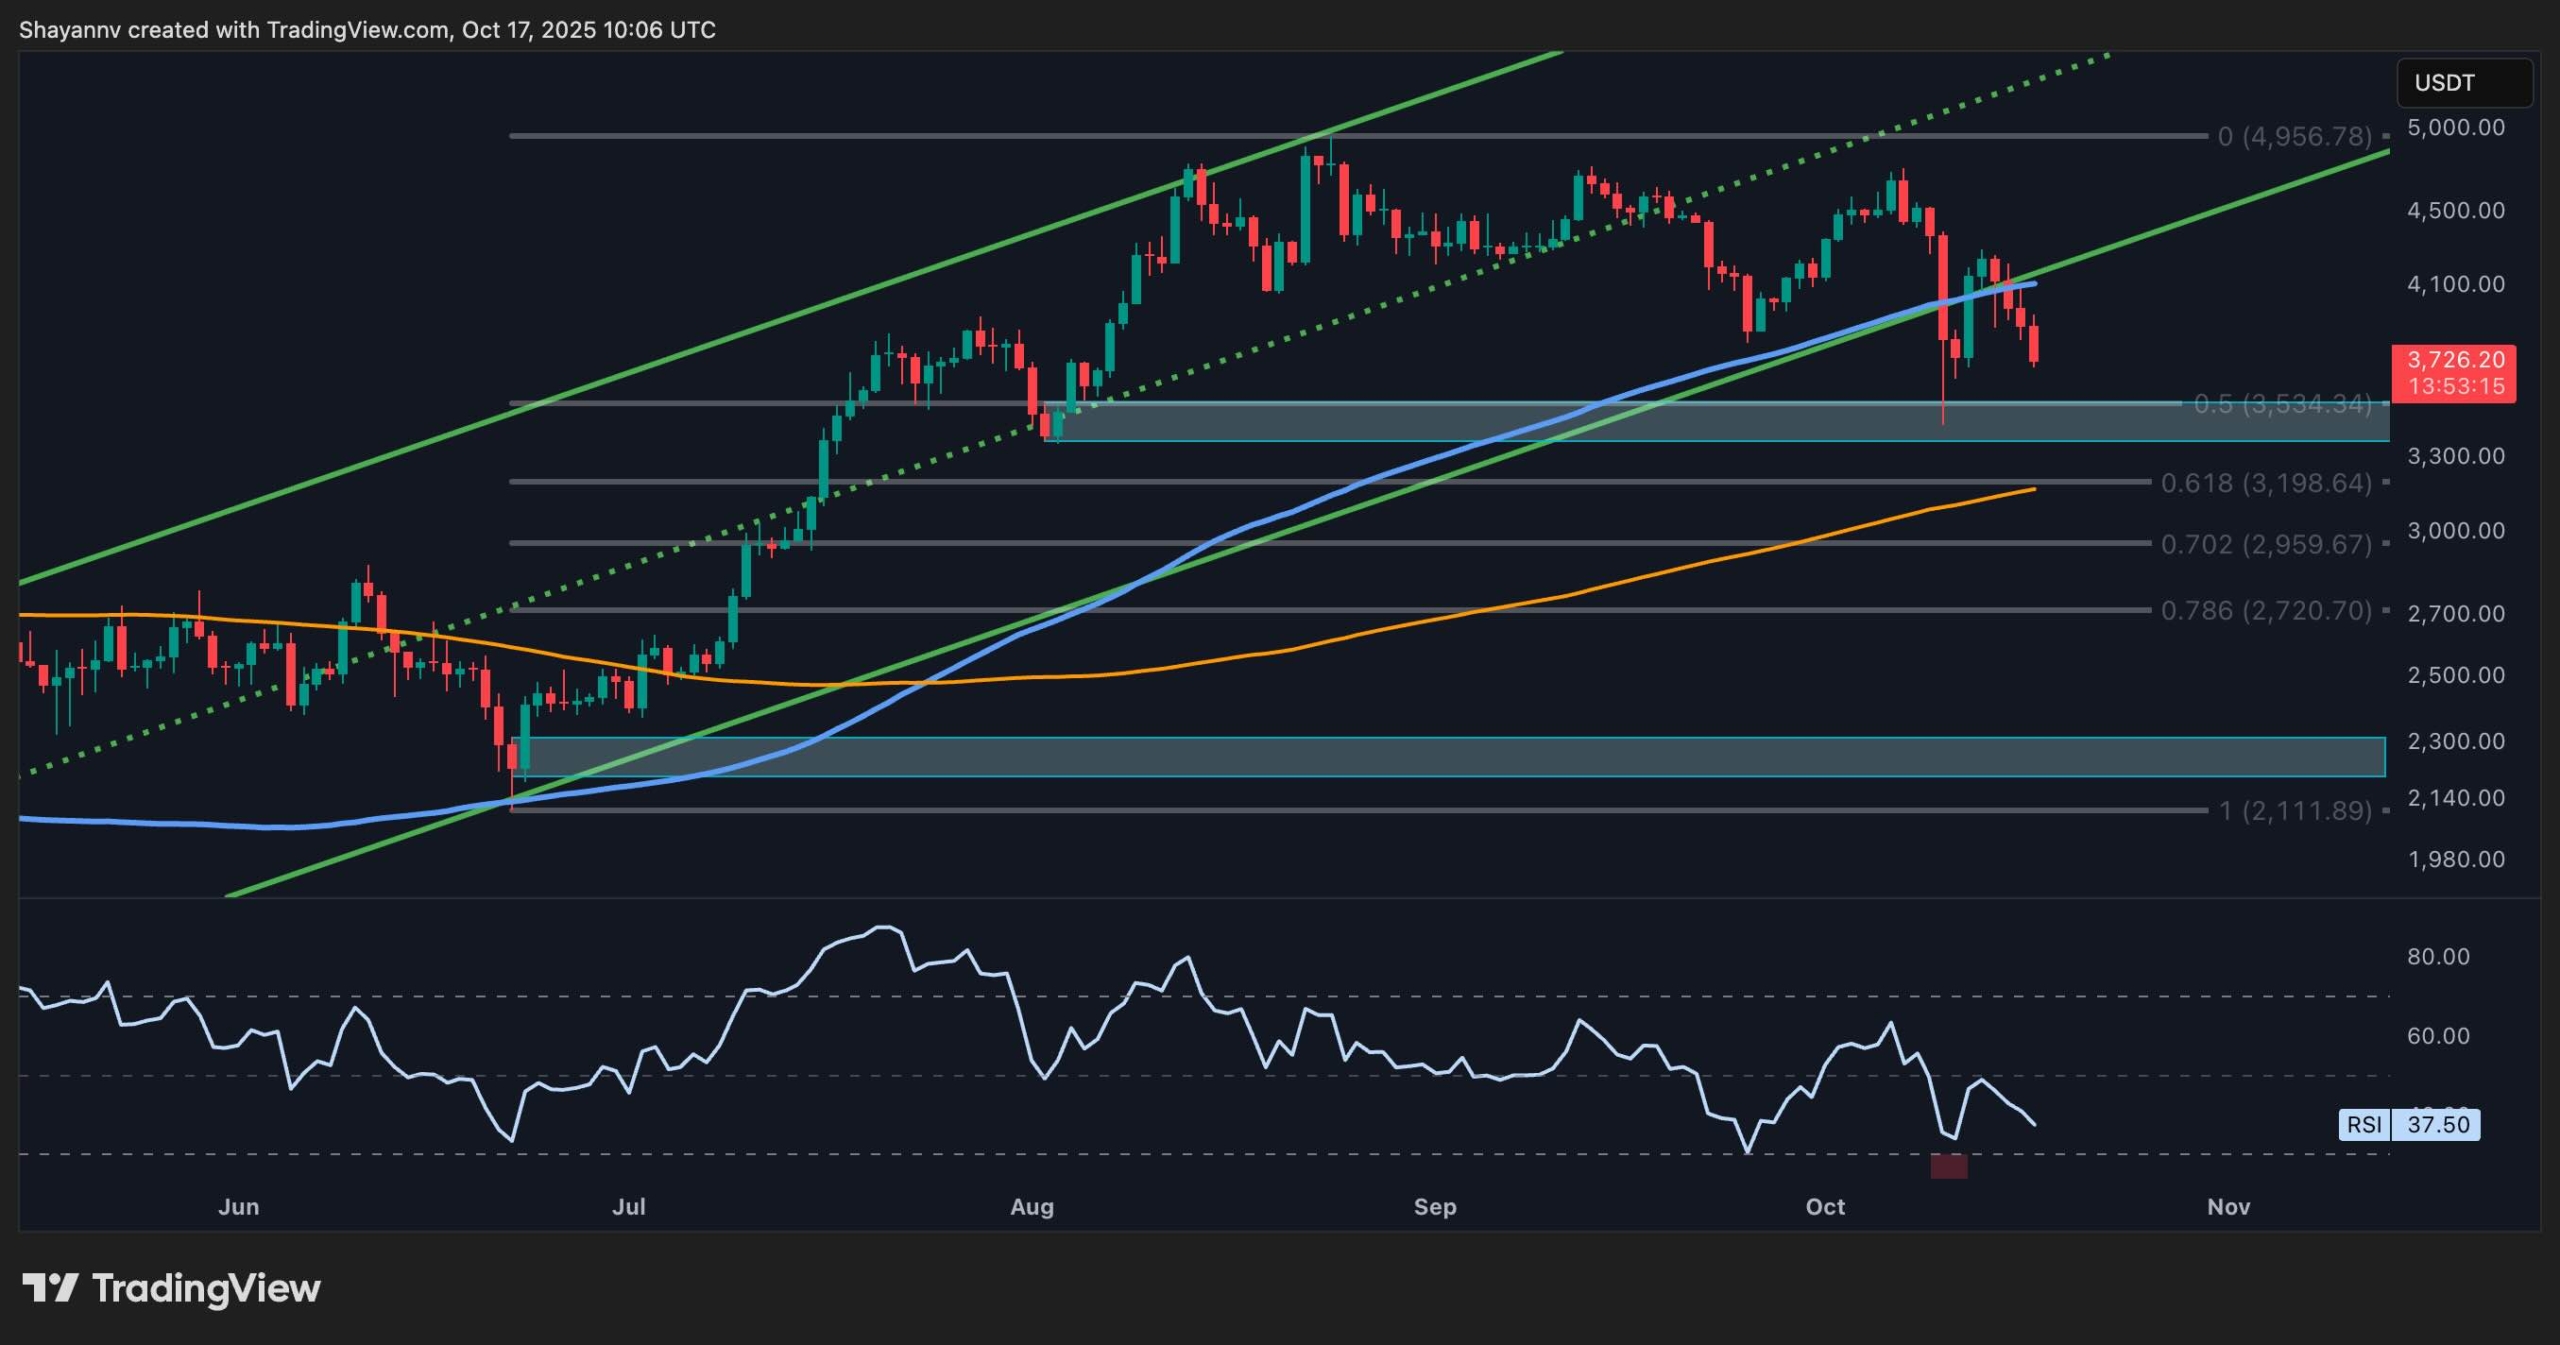
On the daily timeframe, ETH has broken below the long-term ascending channel structure and the 100-day moving average, located around the $4,100 mark. The price is currently moving toward the 0.5 Fibonacci retracement level at $3,530. This zone is a critical area that previously acted as support, and is the base of the most recent rally in August.
The RSI around 37 indicates bearish momentum but hasn’t reached oversold territory yet, implying that more downside is still possible. A clean breakdown below $3,500 could open the way toward the 0.618 retracement level at $3,200, while reclaiming the last price high around $4,200 would be the first sign of recovery.
The 4-Hour Chart
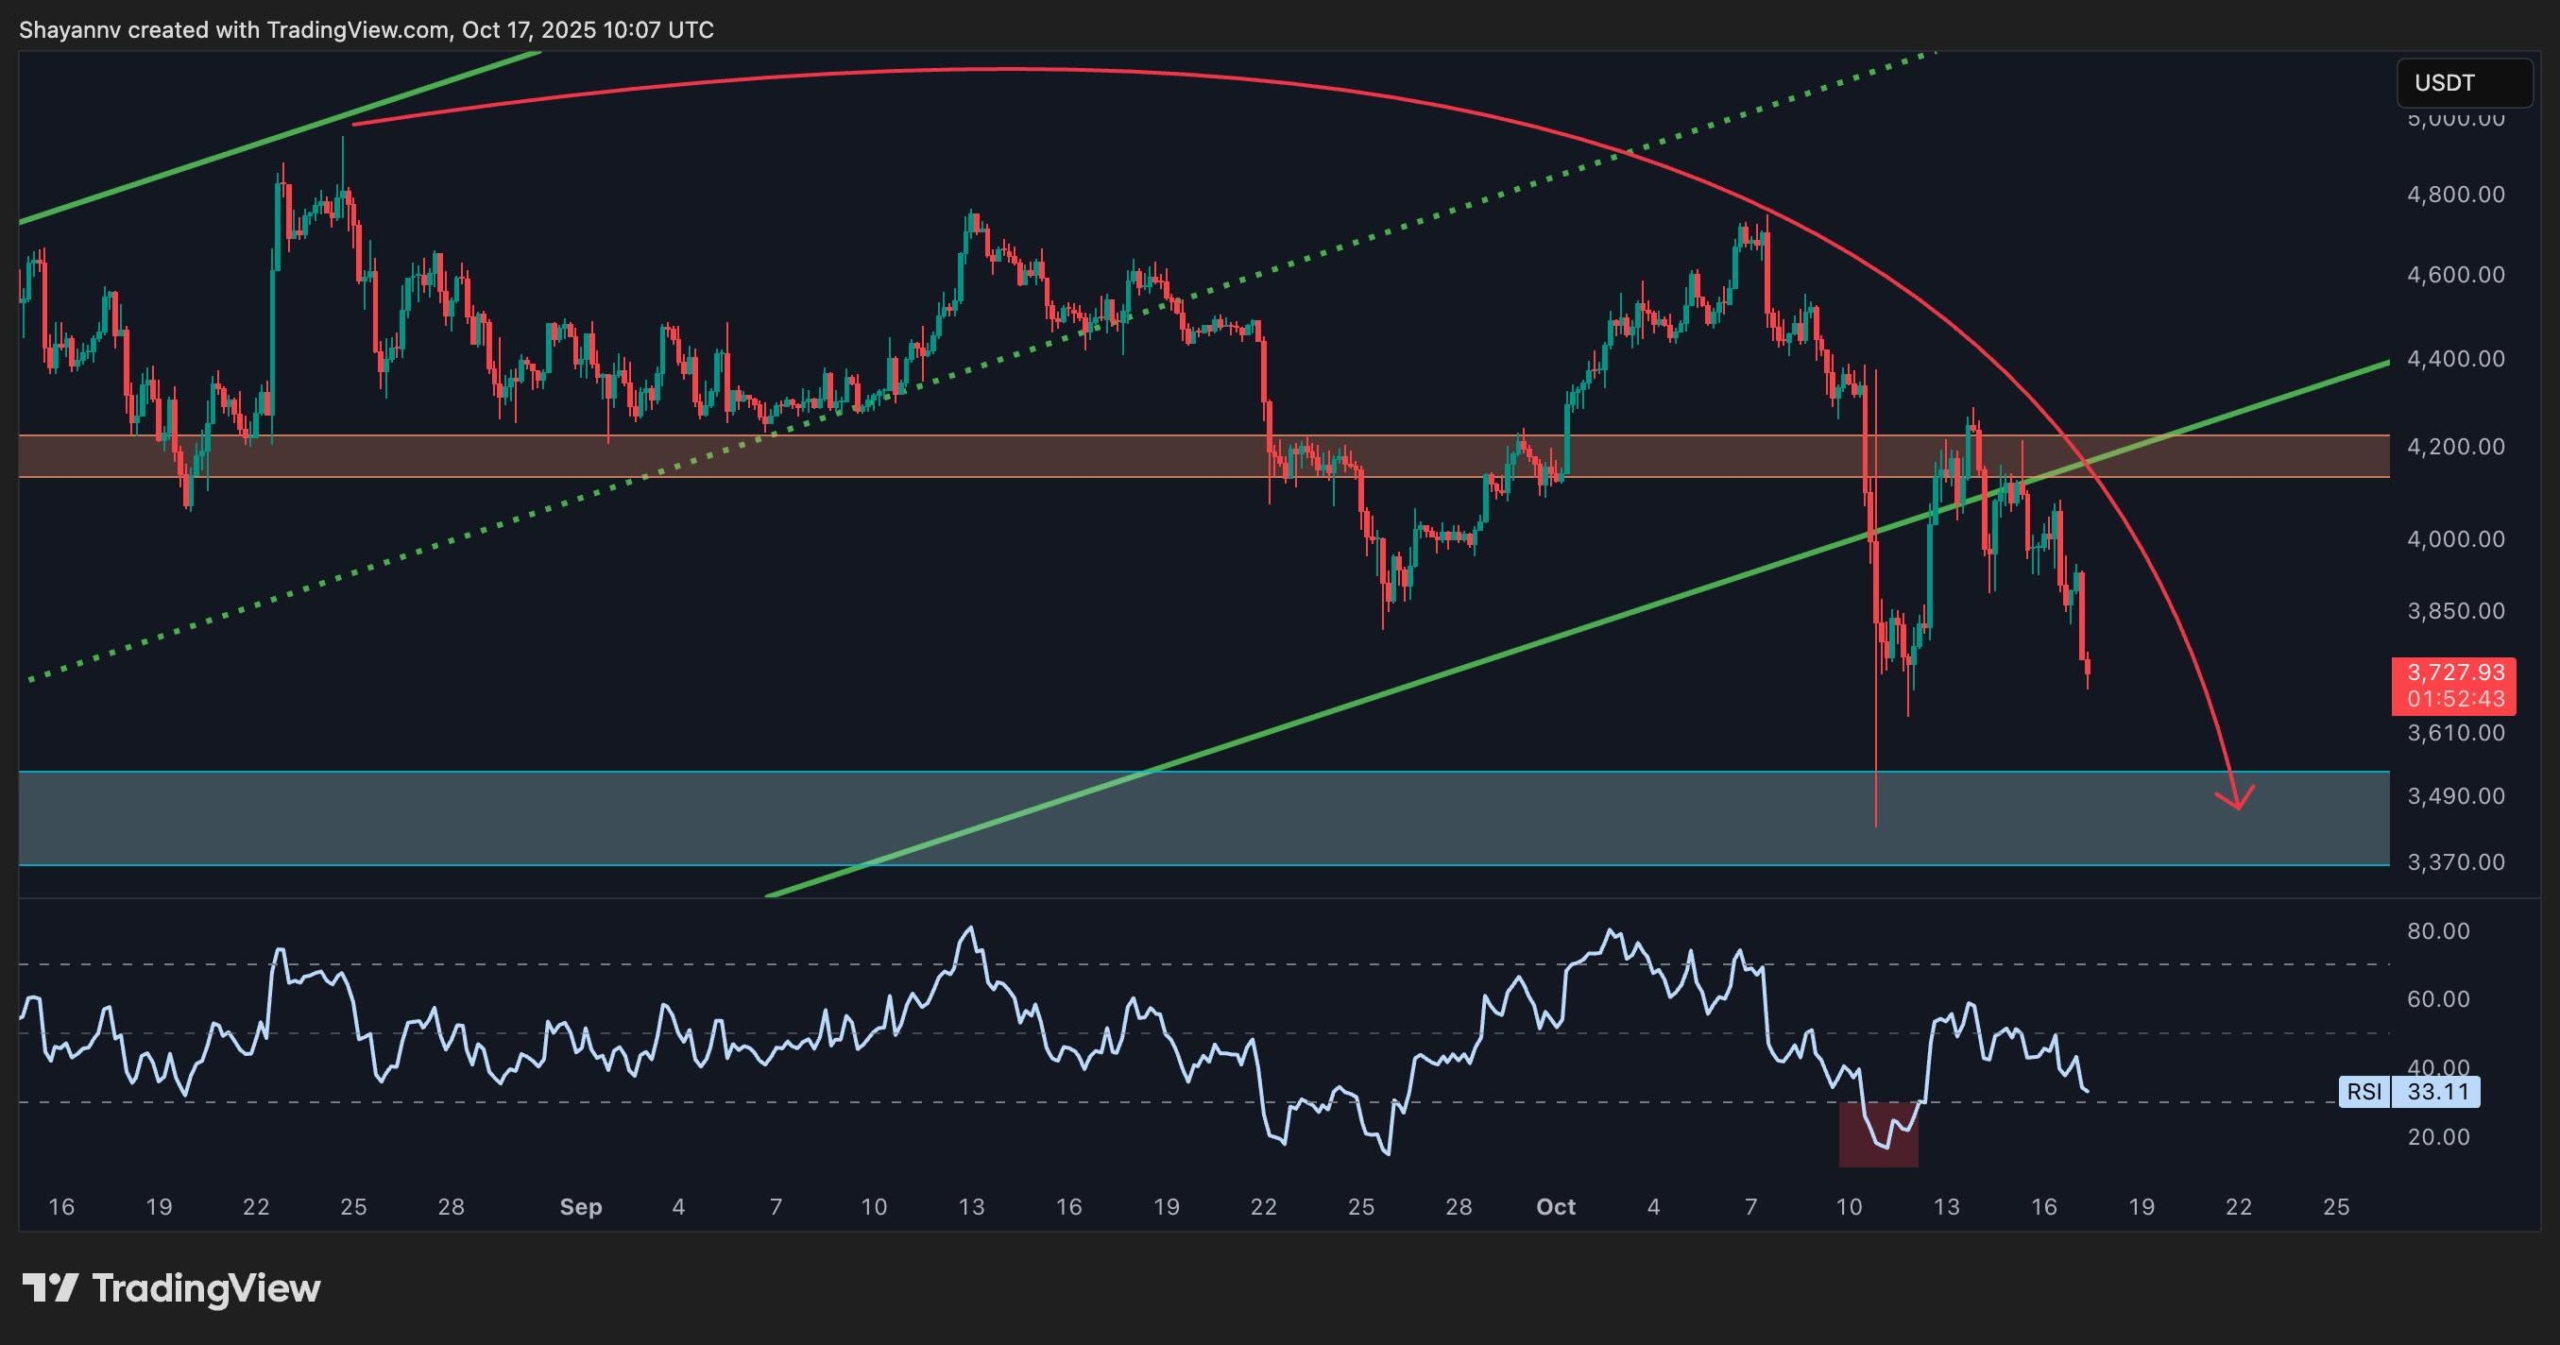
The 4-hour chart shows clear bearish order flow as the downtrend is aggravating after losing the $4,200 level and failing to reclaim it. The recent rejection from this zone has confirmed a shift in the short-term market structure to bearish.
Momentum remains weak with RSI near 33, suggesting sellers still dominate. The next demand zone lies around $3,500–$3,400, where buyers recently held their ground during the massive liquidation event. However, failure to hold this level could accelerate the move toward $3,200 or even $3,000 in a deeper decline.
Sentiment Analysis
Long Liquidations
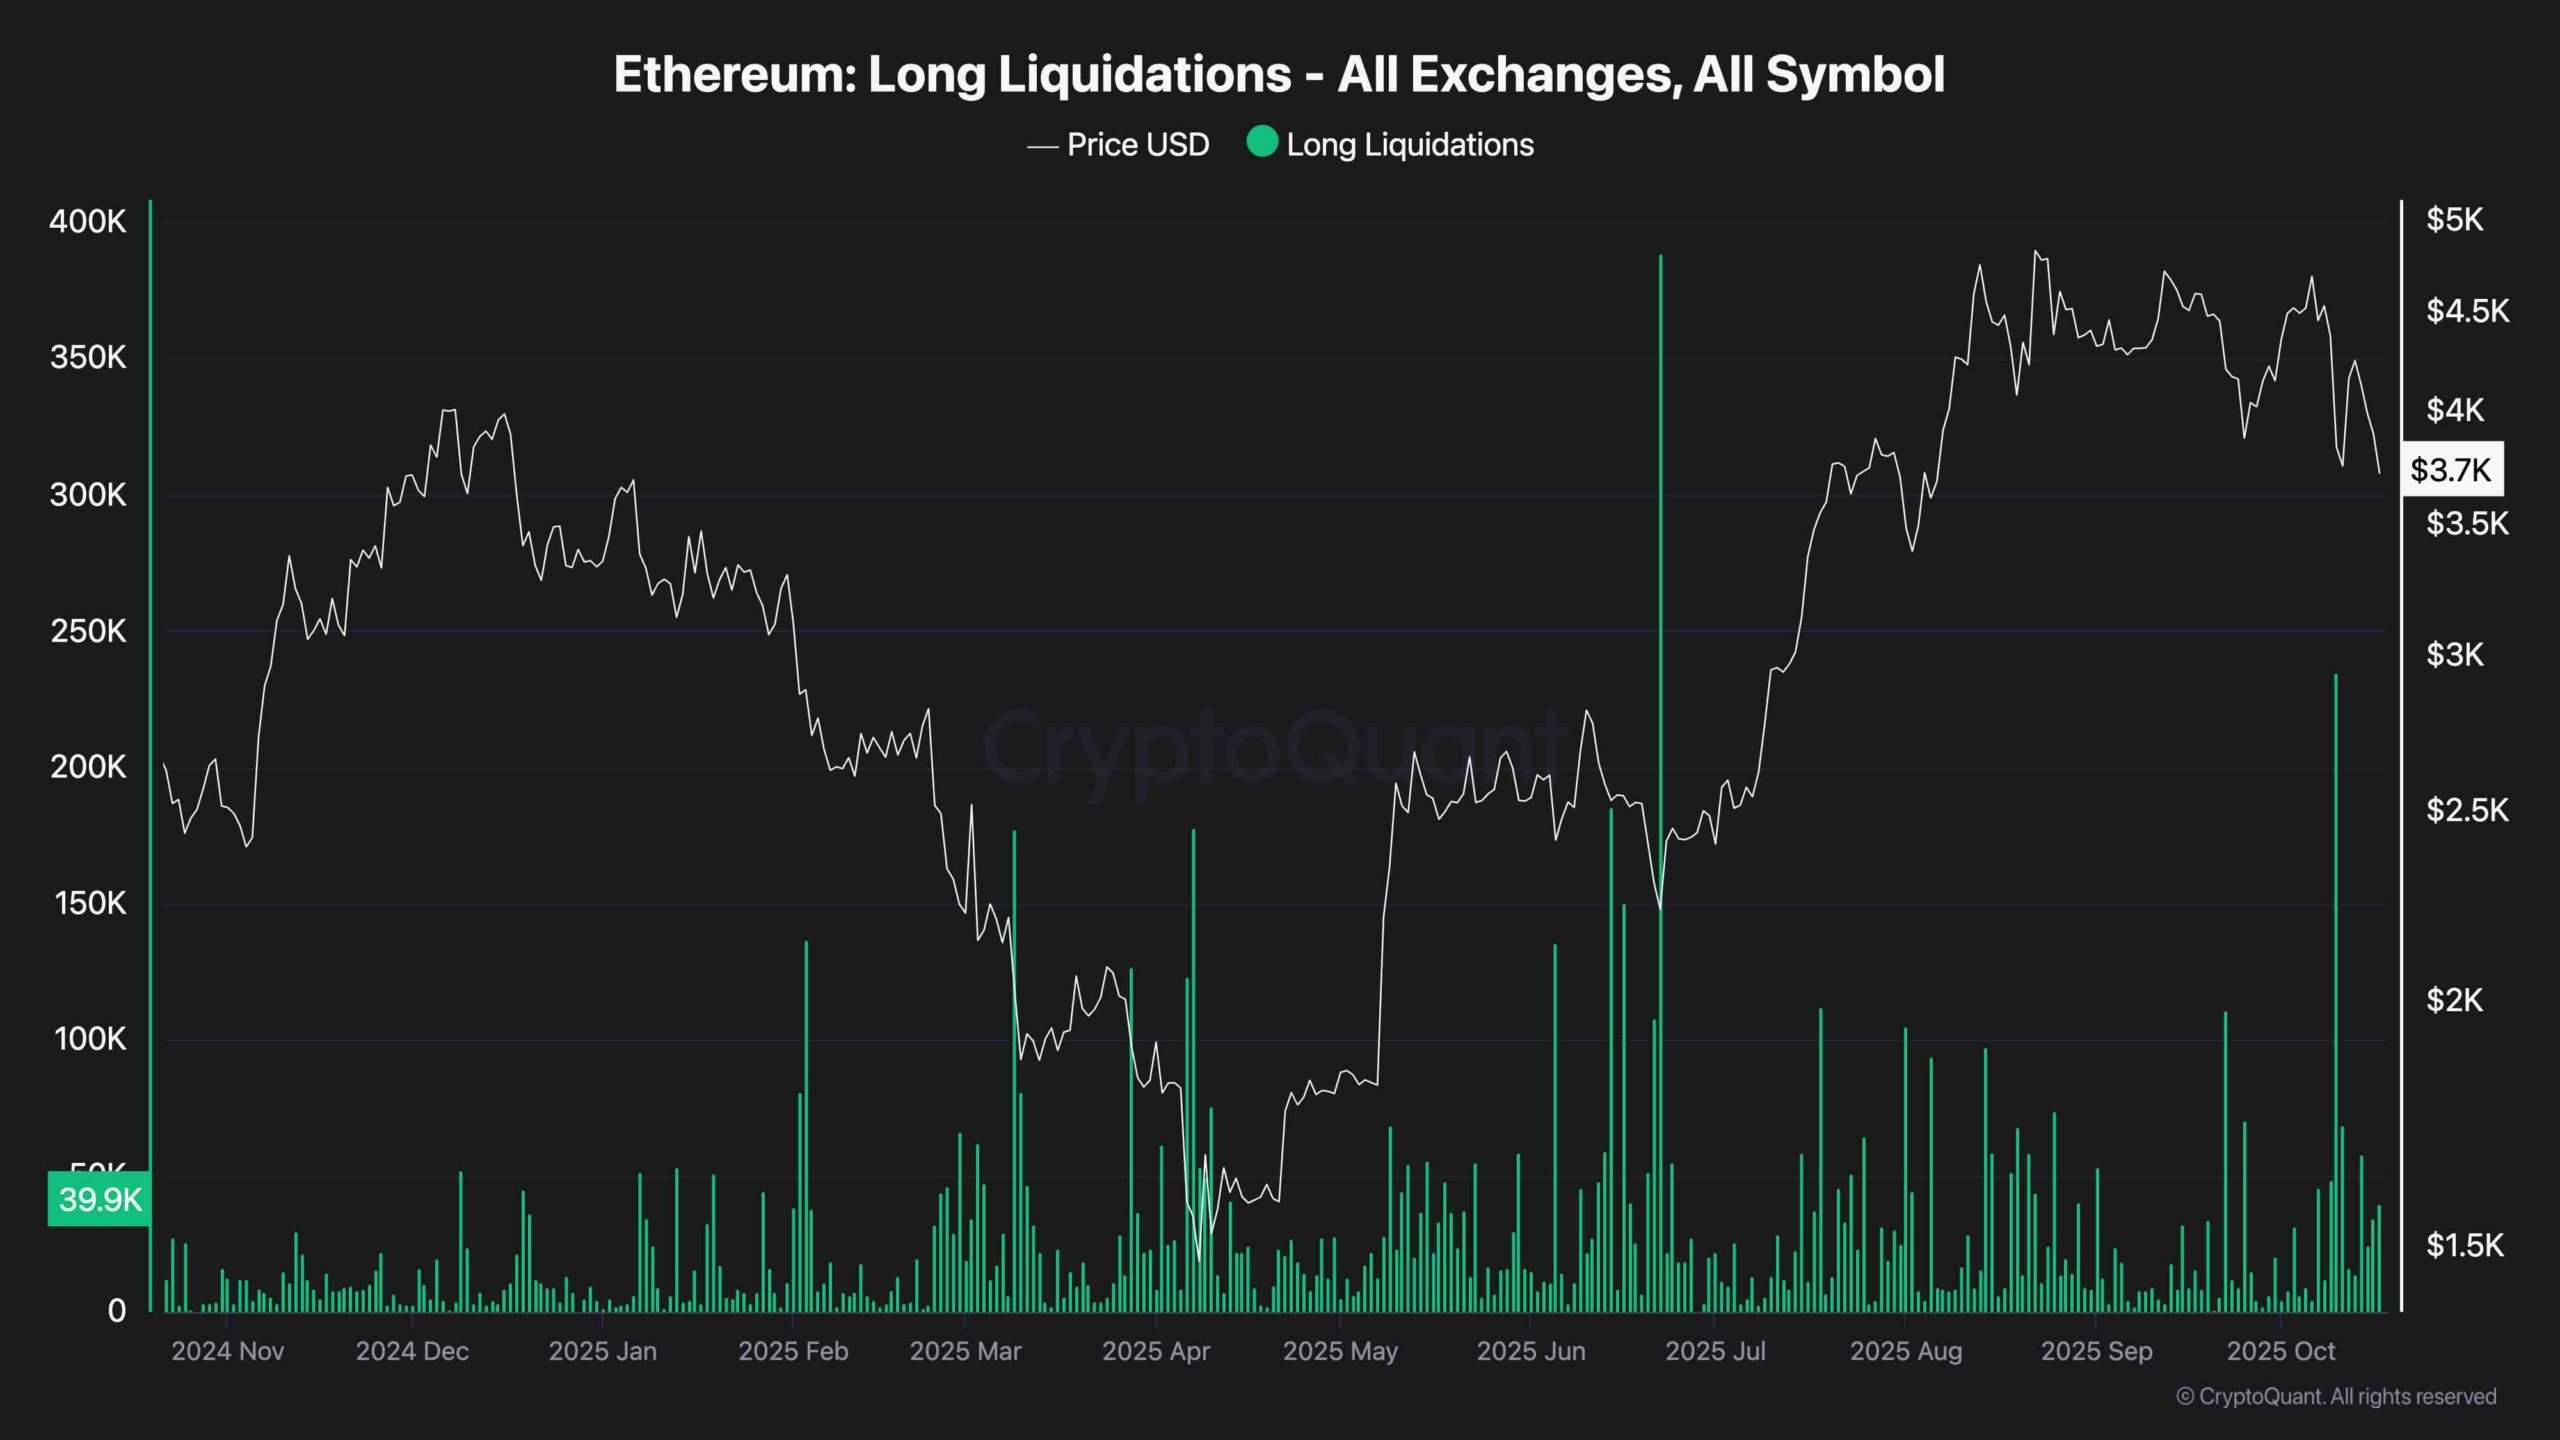
Ethereum’s latest drop triggered a notable spike in long liquidations across all exchanges, marking one of the largest deleveraging events in recent months. This surge in forced selling reflects how overconfident long traders were caught off guard by the market’s swift reversal.
Historically, such liquidation spikes often appear near local bottoms as leveraged positions get flushed out. However, the magnitude of this latest move suggests panic among retail traders, while institutions are likely waiting for clearer confirmation before re-entering.
Overall, the sentiment remains fearful and risk-averse, with traders preferring caution over aggressive long exposure in the short term.
The post Ethereum Price Analysis: Is $3.5K Next for ETH After 13% Weekly Drop? appeared first on CryptoPotato.


추천 콘텐츠

USD/INR Rally Intensifies: US Dollar Gains and Oil Price Surge Shake Indian Forex Market

Samsung Electronics Faces Major Strike Threat as 40,000 Employees Protest Compensation Disparity