

Bull or Bear? ETH Faces Key Test After Another Sharp Pullback
Ethereum is trading at $3,780 after falling 6% in the last 24 hours and 13% over the past week. Despite the pullback, market analysts are split on where the asset could move next.
While some charts suggest a shift in momentum, others point to a completed retest and the potential start of a new upward trend.
Analyst Expects New Leg Toward $10K
Crypto analyst Michaël van de Poppe believes Ethereum may be preparing for its next leg upward. He noted that the asset recently completed a key retest and may break to new highs soon. In his view,
He also added that the retest of the previous resistance zone appears complete, which could open the door for a breakout. Van de Poppe suggested this move could potentially bring Ethereum closer to the $10,000 mark, assuming momentum builds in the short term.
On the ETH/BTC pair, Ethereum is holding above a support level near 0.033 BTC, which had acted as resistance earlier in the year. The asset is now around 0.036 BTC, showing signs of stability. The area has been identified as an “ideal zone for buys” by traders watching the pullback closely.
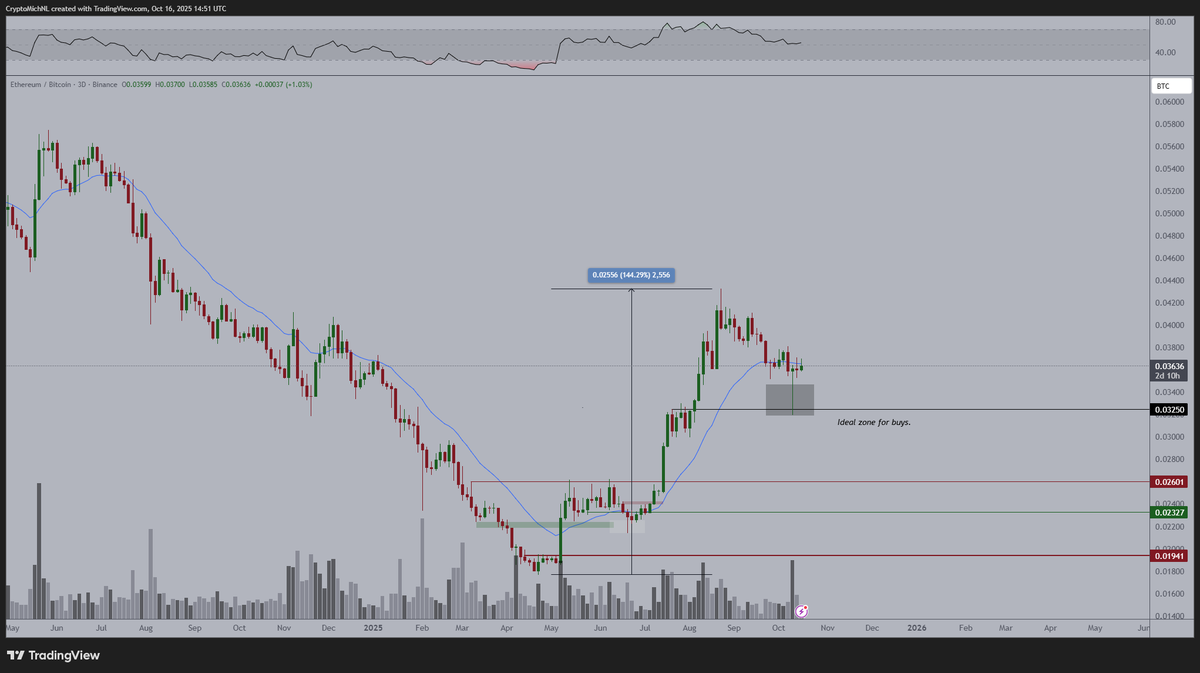 Source: Michaël van de Poppe/X
Volume has dropped during the retracement. These signals support a possible continuation of the prior trend if this support holds. A 44% rally from June to the recent high adds further weight to the idea of another move upward.
MACD Turns Bearish on Weekly Chart
At the same time, other indicators are signaling caution. The weekly MACD has turned red, and the MACD line is curling down toward the signal line. According to Satoshi Stacker,
Previous MACD bearish crossovers on the weekly chart have resulted in losses ranging from 18% to over 80%. While the current signal is not yet confirmed, traders are monitoring for any signs of a deeper correction.
Range Bound with Key Levels to Watch
ETH is currently trading in a range between $3,530 and $4,800, according to Ali Martinez. The $4,100 level has acted as both support and resistance. A break above $4,800 would signal strength, while a drop below $3,530 could confirm a bearish breakdown.
On-chain data shows that over half of Ethereum’s supply is held by ten non-exchange entities. As reported by CryptoPotato, these wallets include custodians, staking pools, and long-term holders, most of whom do not react to short-term price changes.
The post Bull or Bear? ETH Faces Key Test After Another Sharp Pullback appeared first on CryptoPotato.


추천 콘텐츠

What Crypto Whales Buy During Market Uncertainty in 2026

Turnkey PCB Assembly: The Complete Guide for Hardware Engineers and Product Teams


