

XRP Price Prediction: XRP Flashes Death Cross as Traders Eye $1.93 Breakdown

The sharp decline follows a bearish setup triggered by moving average crossovers and a descending triangle pattern. As the broader crypto market weakens, XRP’s trajectory has turned fragile, raising questions about whether this downturn will deepen or set the stage for a major rebound.
Death Cross Triggers Bearish Setup
A trading signal shared by @CryptostarExper on X highlights a death cross between the 10-day and 50-day moving averages—a classic bearish signal that often precedes extended downtrends. The analyst recommended shorting XRP/USD, setting an initial target of $1.9350, with a potential extension toward $1.75 if downward momentum accelerates.
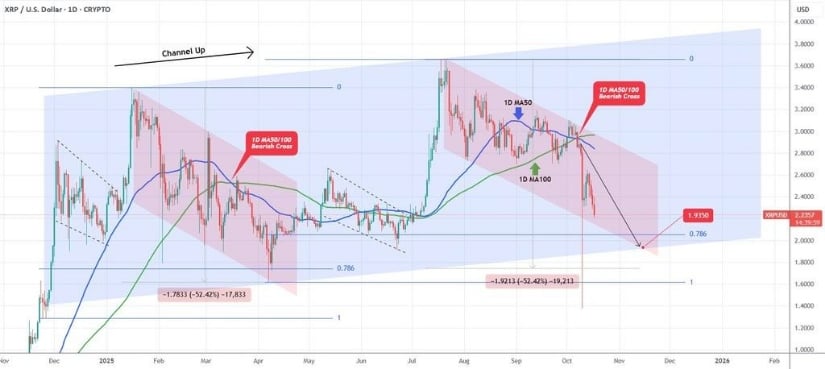
XRP remains in a bearish trend on the daily chart, with downside targets at $1.93 and a potential extension to $1.75. Source: @CryptostarExper via X
The signal aligns with current price action. As of October 17, XRP current price sits near $2.27, down about 5.5% on the day. The price structure is locked inside a descending triangle, typically a continuation pattern that favors the bears when it breaks to the downside.
Technical support levels at $1.83 remain critical, followed by a long-term floor near $0.78. Any decisive breakdown could lead to increased volatility and deeper retracements.
XRP Price Under Pressure Amid Broad Market Weakness
Over the past week, XRP price today has broken below key short-term supports, signaling the ongoing downtrend is far from over. On the 4-hour chart, XRP has slipped under $2.30 and remains unable to reclaim the $3.15 resistance.
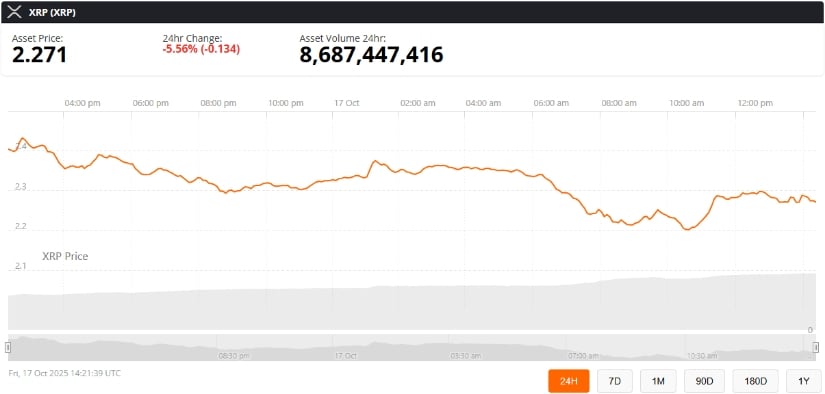
XRP was trading at around $2.27, down 5.56% in the last 24 hours at press time. Source: XRP price via Brave New Coin
The Relative Strength Index (RSI) currently stands at 31.65—deep in bearish territory—while the Money Flow Index (MFI) confirms that capital outflows are outweighing inflows. This trend indicates fading buyer interest and sustained selling activity, putting further pressure on the XRP coin price.
If this momentum persists, XRP could retest support near $1.91 before any meaningful rebound attempt.
Key Technical Levels to Watch
The Awesome Oscillator (AO) currently prints red histogram bars, confirming strong bearish momentum. The Chaikin Money Flow (CMF) remains in negative territory at -0.08, further signaling capital outflows.
Immediate resistance levels are set at $2.49 (0.382 Fib) and $2.58, while stronger resistance sits near $3.00. If bulls can reclaim these zones, the XRP price prediction could shift toward a recovery targeting $3.29 (0.786 Fib).
However, if bearish momentum continues, the Ripple XRP price may slide below $1.93—a level that could determine whether the downtrend stabilizes or deepens further.
Historical Patterns Suggest Long-Term Potential
Despite the short-term pain, some analysts remain optimistic about XRP’s broader trajectory. Historical overlays of XRP’s 2013–2018 and 2018–2025 price cycles reveal similar rejection and accumulation patterns around prior all-time highs. In previous cycles, such accumulation often preceded sharp parabolic rallies.
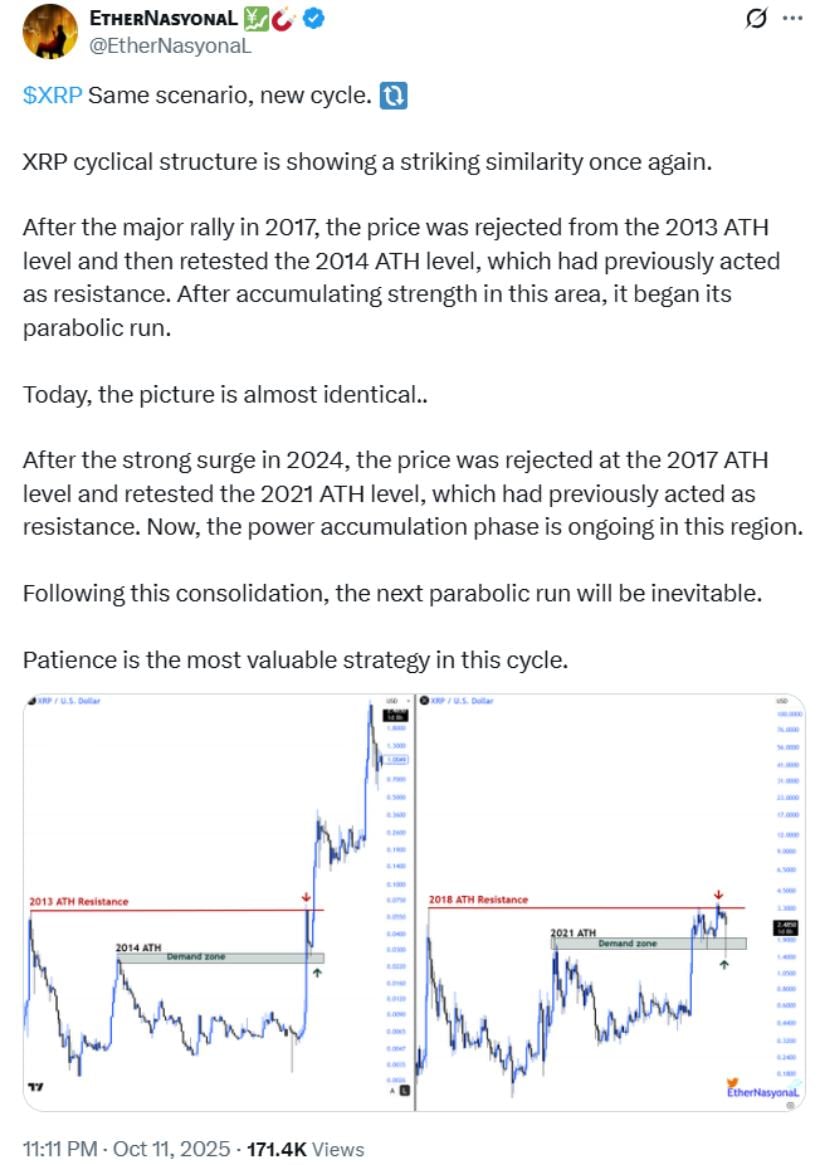
XRP’s cyclical structure mirrors past bull runs, with current consolidation at key support levels signaling a potential parabolic rally ahead. Source: @EtherNasyonaL via X
XRP peaked at $3.84 in January 2018 after consolidating near $0.60, then repeated a similar structure around $1.96 in 2021. If history rhymes, XRP could be building a base for a larger move once accumulation ends and momentum shifts.
Outlook: Bearish Near Term, Uncertain Mid-Term
For now, the market structure remains tilted to the downside, with lower highs and lower lows forming across major timeframes. Unless volume increases and momentum indicators improve, the XRP price forecast points to continued pressure around key support levels.
Still, upcoming developments—such as a potential Grayscale Investments XRP ETF filing or progress in the XRP lawsuit—could act as catalysts for a rebound if sentiment improves.
While traders eye the $1.93 breakdown, long-term investors are watching whether these technical signals evolve into another cyclical accumulation phase—a pattern that has historically preceded major upside runs in Ripple XRP.


추천 콘텐츠

WLFI co-founder Zach Witkoff under spotlight after 2022 drug arrest video surfaces

TSAM London: Clearwater Analytics on Why a Clear Data Strategy is the Foundation for Financial Firms


