Popular technician Charting Guy (@ChartingGuy) calls Shiba Inu “weak and choppy” and suggests the token may not break out until late in the current crypto cycle. Sharing a weekly Shiba Inu chart, he wrote on Oct. 26, 2025: “SHIB has been weak and choppy all cycle. Won’t do anything until the end imo.” How High Can Shiba Inu Price Go? The below TradingView chart is a weekly SHIB/USD study anchored to a Fibonacci ladder. The price marker on the right rail reads $0.000010205, placing SHIB fractionally below the 0.236 retracement band annotated at $0.000011043. Above that, the chart maps successive overhead levels at 0.382 near $0.000016434, 0.5 around $0.000022661, 0.618 near $0.000031247 and 0.786 at about $0.000049369. The red 1 line flags $0.000088410, with higher extension markers plotted at 1.272 ≈ $0.000185406, 1.414 ≈ $0.000272917 and a terminal 1.618 ≈ $0.000475605. A stylized projection trace on the chart depicts a late-cycle, near-vertical advance that only materializes after a prolonged base and then stalls inside the 1.0–1.272 cluster before breaking above the 1.272 Fib extension and topping below the 1.414 Fib extension roughly at $0.000022; the path visually reinforces the author’s contention that SHIB underperforms until the “end.” Related Reading: Shiba Inu Holds Firm Despite 18% Crash, 1.5M Holders Signal Faith in 2025 Recovery In a separate post on Oct. 24, Charting Guy ranked market structures across majors and large-cap altcoins, explicitly placing SHIB in his “Bad Looking Charts” bucket while labeling Bitcoin, Ether, XRP, Solana, BNB and Stellar as “Good Looking Charts.” His list read, in part: “Good Looking Charts: BTC, ETH, XRP, SOL, BNB, XLM … Decent Looking Charts: XDC, DOGE, PENGU, ADA, ONDO, SUI, AAVE, LTC … Eh Looking Charts: PEPE, FLOKI, FLR, LINK, BCH … Bad Looking Charts: SHIB, WIF, ETC, AVAX, FET, RENDER, INJ, CRV, ALGO, SOLO, COREUM, NEAR, VET, COMP, DOT, IOTA, FIL, ATOM, And many more.” What To Expect The technical message is unambiguous: on a weekly timeframe, SHIB remains capped beneath early Fibonacci thresholds that many chartists treat as momentum gates. Remaining below 0.236 typically signals that price has yet to reclaim even the shallowest retracement of the prior cycle; clearing it often opens room to test the 0.382–0.5 midpoint zone where trends either accelerate or fail. Related Reading: Here’s Why The Shiba Inu Price Could Bottom And Rise Another 40% In Charting Guy’s map, structurally meaningful inflection areas stack tightly from roughly $0.000016 to $0.000031, with the 0.618 level near $0.000031 attributed the role of a trend-confirmation threshold. The cycle-top roadmap he drew concentrates risk and reward into the higher cluster around $0.000088 to $0.000185, a range often watched by Fibonacci practitioners for exhaustion and distribution in late-stage moves. However, a rise to $0.00022 could still mean an incredible upside for SHIB of around 2,055.81%—a roughly 20.56-fold increase. Contextually, his relative-strength table is just as important as the levels. By grouping SHIB with other “bad looking” structures while upgrading Bitcoin, Ether, XRP, Solana and BNB, he is signaling an expectation that market breadth will remain narrow and quality-led before any speculative rotation into meme-beta like SHIB. That framework aligns with his succinct call that SHIB “won’t do anything until the end,” implying a sequencing view rather than a categorical dismissal. At press time, SHIB traded at $0.00001046. Featured image created with DALL.E, chart from TradingView.comPopular technician Charting Guy (@ChartingGuy) calls Shiba Inu “weak and choppy” and suggests the token may not break out until late in the current crypto cycle. Sharing a weekly Shiba Inu chart, he wrote on Oct. 26, 2025: “SHIB has been weak and choppy all cycle. Won’t do anything until the end imo.” How High Can Shiba Inu Price Go? The below TradingView chart is a weekly SHIB/USD study anchored to a Fibonacci ladder. The price marker on the right rail reads $0.000010205, placing SHIB fractionally below the 0.236 retracement band annotated at $0.000011043. Above that, the chart maps successive overhead levels at 0.382 near $0.000016434, 0.5 around $0.000022661, 0.618 near $0.000031247 and 0.786 at about $0.000049369. The red 1 line flags $0.000088410, with higher extension markers plotted at 1.272 ≈ $0.000185406, 1.414 ≈ $0.000272917 and a terminal 1.618 ≈ $0.000475605. A stylized projection trace on the chart depicts a late-cycle, near-vertical advance that only materializes after a prolonged base and then stalls inside the 1.0–1.272 cluster before breaking above the 1.272 Fib extension and topping below the 1.414 Fib extension roughly at $0.000022; the path visually reinforces the author’s contention that SHIB underperforms until the “end.” Related Reading: Shiba Inu Holds Firm Despite 18% Crash, 1.5M Holders Signal Faith in 2025 Recovery In a separate post on Oct. 24, Charting Guy ranked market structures across majors and large-cap altcoins, explicitly placing SHIB in his “Bad Looking Charts” bucket while labeling Bitcoin, Ether, XRP, Solana, BNB and Stellar as “Good Looking Charts.” His list read, in part: “Good Looking Charts: BTC, ETH, XRP, SOL, BNB, XLM … Decent Looking Charts: XDC, DOGE, PENGU, ADA, ONDO, SUI, AAVE, LTC … Eh Looking Charts: PEPE, FLOKI, FLR, LINK, BCH … Bad Looking Charts: SHIB, WIF, ETC, AVAX, FET, RENDER, INJ, CRV, ALGO, SOLO, COREUM, NEAR, VET, COMP, DOT, IOTA, FIL, ATOM, And many more.” What To Expect The technical message is unambiguous: on a weekly timeframe, SHIB remains capped beneath early Fibonacci thresholds that many chartists treat as momentum gates. Remaining below 0.236 typically signals that price has yet to reclaim even the shallowest retracement of the prior cycle; clearing it often opens room to test the 0.382–0.5 midpoint zone where trends either accelerate or fail. Related Reading: Here’s Why The Shiba Inu Price Could Bottom And Rise Another 40% In Charting Guy’s map, structurally meaningful inflection areas stack tightly from roughly $0.000016 to $0.000031, with the 0.618 level near $0.000031 attributed the role of a trend-confirmation threshold. The cycle-top roadmap he drew concentrates risk and reward into the higher cluster around $0.000088 to $0.000185, a range often watched by Fibonacci practitioners for exhaustion and distribution in late-stage moves. However, a rise to $0.00022 could still mean an incredible upside for SHIB of around 2,055.81%—a roughly 20.56-fold increase. Contextually, his relative-strength table is just as important as the levels. By grouping SHIB with other “bad looking” structures while upgrading Bitcoin, Ether, XRP, Solana and BNB, he is signaling an expectation that market breadth will remain narrow and quality-led before any speculative rotation into meme-beta like SHIB. That framework aligns with his succinct call that SHIB “won’t do anything until the end,” implying a sequencing view rather than a categorical dismissal. At press time, SHIB traded at $0.00001046. Featured image created with DALL.E, chart from TradingView.com
Shiba Inu Looks Weak—But Hides A 2,000% End-Cycle Breakout: Analyst
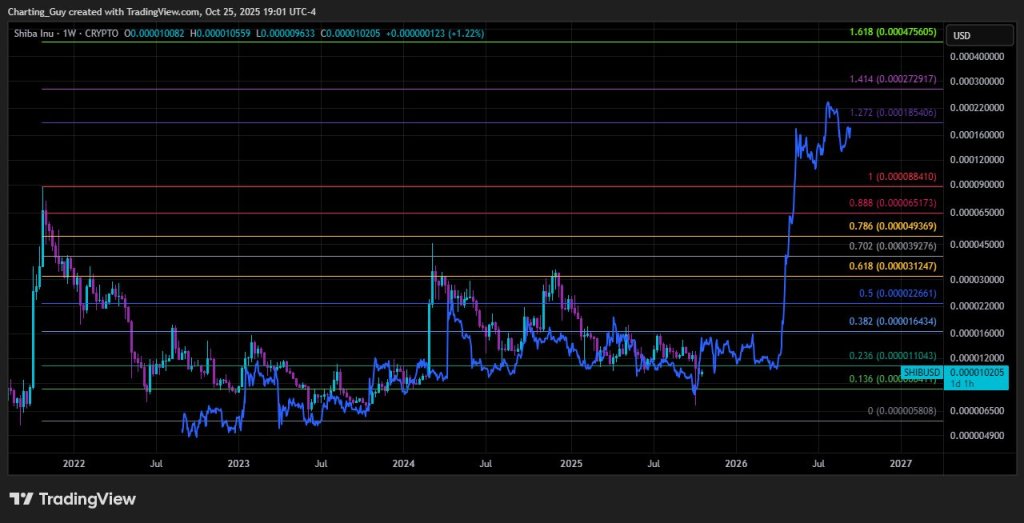
Popular technician Charting Guy (@ChartingGuy) calls Shiba Inu “weak and choppy” and suggests the token may not break out until late in the current crypto cycle. Sharing a weekly Shiba Inu chart, he wrote on Oct. 26, 2025: “SHIB has been weak and choppy all cycle. Won’t do anything until the end imo.”
How High Can Shiba Inu Price Go?
The below TradingView chart is a weekly SHIB/USD study anchored to a Fibonacci ladder. The price marker on the right rail reads $0.000010205, placing SHIB fractionally below the 0.236 retracement band annotated at $0.000011043.
Above that, the chart maps successive overhead levels at 0.382 near $0.000016434, 0.5 around $0.000022661, 0.618 near $0.000031247 and 0.786 at about $0.000049369. The red 1 line flags $0.000088410, with higher extension markers plotted at 1.272 ≈ $0.000185406, 1.414 ≈ $0.000272917 and a terminal 1.618 ≈ $0.000475605.
A stylized projection trace on the chart depicts a late-cycle, near-vertical advance that only materializes after a prolonged base and then stalls inside the 1.0–1.272 cluster before breaking above the 1.272 Fib extension and topping below the 1.414 Fib extension roughly at $0.000022; the path visually reinforces the author’s contention that SHIB underperforms until the “end.”
In a separate post on Oct. 24, Charting Guy ranked market structures across majors and large-cap altcoins, explicitly placing SHIB in his “Bad Looking Charts” bucket while labeling Bitcoin, Ether, XRP, Solana, BNB and Stellar as “Good Looking Charts.” His list read, in part: “Good Looking Charts: BTC, ETH, XRP, SOL, BNB, XLM … Decent Looking Charts: XDC, DOGE, PENGU, ADA, ONDO, SUI, AAVE, LTC … Eh Looking Charts: PEPE, FLOKI, FLR, LINK, BCH … Bad Looking Charts: SHIB, WIF, ETC, AVAX, FET, RENDER, INJ, CRV, ALGO, SOLO, COREUM, NEAR, VET, COMP, DOT, IOTA, FIL, ATOM, And many more.”
What To Expect
The technical message is unambiguous: on a weekly timeframe, SHIB remains capped beneath early Fibonacci thresholds that many chartists treat as momentum gates. Remaining below 0.236 typically signals that price has yet to reclaim even the shallowest retracement of the prior cycle; clearing it often opens room to test the 0.382–0.5 midpoint zone where trends either accelerate or fail.
In Charting Guy’s map, structurally meaningful inflection areas stack tightly from roughly $0.000016 to $0.000031, with the 0.618 level near $0.000031 attributed the role of a trend-confirmation threshold. The cycle-top roadmap he drew concentrates risk and reward into the higher cluster around $0.000088 to $0.000185, a range often watched by Fibonacci practitioners for exhaustion and distribution in late-stage moves. However, a rise to $0.00022 could still mean an incredible upside for SHIB of around 2,055.81%—a roughly 20.56-fold increase.
Contextually, his relative-strength table is just as important as the levels. By grouping SHIB with other “bad looking” structures while upgrading Bitcoin, Ether, XRP, Solana and BNB, he is signaling an expectation that market breadth will remain narrow and quality-led before any speculative rotation into meme-beta like SHIB. That framework aligns with his succinct call that SHIB “won’t do anything until the end,” implying a sequencing view rather than a categorical dismissal.
면책 조항: 본 사이트에 재게시된 글들은 공개 플랫폼에서 가져온 것으로 정보 제공 목적으로만 제공됩니다. 이는 반드시 MEXC의 견해를 반영하는 것은 아닙니다. 모든 권리는 원저자에게 있습니다. 제3자의 권리를 침해하는 콘텐츠가 있다고 판단될 경우, crypto.news@mexc.com으로 연락하여 삭제 요청을 해주시기 바랍니다. MEXC는 콘텐츠의 정확성, 완전성 또는 시의적절성에 대해 어떠한 보증도 하지 않으며, 제공된 정보에 기반하여 취해진 어떠한 조치에 대해서도 책임을 지지 않습니다. 본 콘텐츠는 금융, 법률 또는 기타 전문적인 조언을 구성하지 않으며, MEXC의 추천이나 보증으로 간주되어서는 안 됩니다.