Silver (XAG/USD) extends its recovery for the third consecutive session on Thursday, trading near $48.70, up nearly 2.40% on the day, as buyers return after defending the $45.00-$46.00 demand zone.
The rebound follows a sharp correction that saw the metal fall nearly 16% from its all-time high of $54.86 earlier this month to a one-month low of $45.56, before stabilizing above its 50-day Simple Moving Average (SMA).
The latest leg higher appears to be driven more by technical buying than fresh fundamental catalysts, as improved risk sentiment surrounding the US-China trade truce has, in fact, limited safe-haven demand for precious metals.
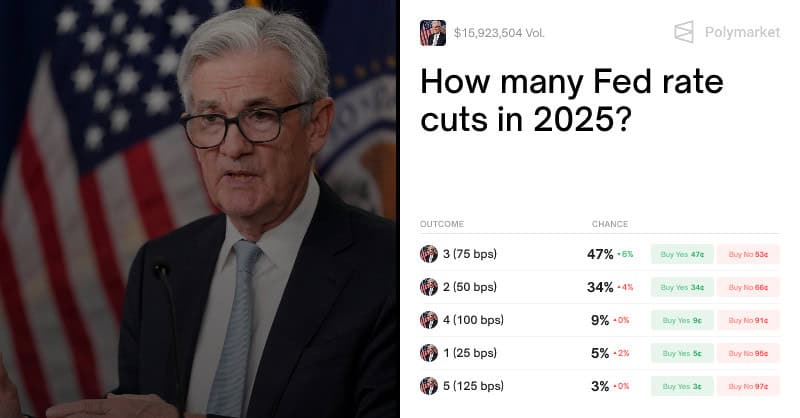
However, some support stems from the Federal Reserve’s (Fed) interest rate cut on Wednesday, though the upside remains capped after markets interpreted it as a hawkish cut following Fed Chair Jerome Powell’s signal that further policy easing is unlikely, saying that “a further reduction in the policy rate at the December meeting is not a foregone conclusion.”
From a technical perspective, the daily chart continues to show a broader uptrend despite the recent sharp correction. On the upside, immediate resistance is seen in the $49.00-$49.50 zone, which has capped gains in recent sessions and coincides with the 21-day SMA. A decisive close above this area would strengthen the case for a resumption of the uptrend.
On the downside, initial support lies at Thursday’s low of $47.26, followed by $45.56, the October 28 low, which closely aligns with the 50-day SMA, a region where dip-buying interest has recently emerged. A break below this zone would risk extending the corrective pullback toward the next key area around $44.50-$43.00.
The Relative Strength Index (RSI) has recovered to 53 after briefly dipping below the neutral 50 mark, suggesting that bearish momentum has slightly eased while buyers are beginning to regain control. Overall, Silver maintains a constructive near-term outlook, with the broader trend still intact as long as the metal holds above $45.50.
Meanwhile, the Fixed Range Volume Profile drawn from the September 18 low of $41.20 to the all-time high of $54.86 shows the Point of Control (POC) around $48.20-$48.50, indicating a critical area of volume-based support where recent consolidation has been concentrated.
Silver FAQs
Silver is a precious metal highly traded among investors. It has been historically used as a store of value and a medium of exchange. Although less popular than Gold, traders may turn to Silver to diversify their investment portfolio, for its intrinsic value or as a potential hedge during high-inflation periods. Investors can buy physical Silver, in coins or in bars, or trade it through vehicles such as Exchange Traded Funds, which track its price on international markets.
Silver prices can move due to a wide range of factors. Geopolitical instability or fears of a deep recession can make Silver price escalate due to its safe-haven status, although to a lesser extent than Gold’s. As a yieldless asset, Silver tends to rise with lower interest rates. Its moves also depend on how the US Dollar (USD) behaves as the asset is priced in dollars (XAG/USD). A strong Dollar tends to keep the price of Silver at bay, whereas a weaker Dollar is likely to propel prices up. Other factors such as investment demand, mining supply – Silver is much more abundant than Gold – and recycling rates can also affect prices.
Silver is widely used in industry, particularly in sectors such as electronics or solar energy, as it has one of the highest electric conductivity of all metals – more than Copper and Gold. A surge in demand can increase prices, while a decline tends to lower them. Dynamics in the US, Chinese and Indian economies can also contribute to price swings: for the US and particularly China, their big industrial sectors use Silver in various processes; in India, consumers’ demand for the precious metal for jewellery also plays a key role in setting prices.
Silver prices tend to follow Gold’s moves. When Gold prices rise, Silver typically follows suit, as their status as safe-haven assets is similar. The Gold/Silver ratio, which shows the number of ounces of Silver needed to equal the value of one ounce of Gold, may help to determine the relative valuation between both metals. Some investors may consider a high ratio as an indicator that Silver is undervalued, or Gold is overvalued. On the contrary, a low ratio might suggest that Gold is undervalued relative to Silver.
Source: https://www.fxstreet.com/news/silver-price-forecast-xag-usd-steadies-above-50-day-sma-after-sharp-16-correction-202510301508