Another Bitcoin (BTC) Warning Sign? MACD Flashes Bearish, Price Falls
Bitcoin has dropped below key technical levels, raising attention among traders and analysts.
A bearish crossover on the 3-week MACD, combined with declining price action, suggests weakening momentum as the asset struggles to hold near $104,000.
MACD Cross Suggests Momentum Shift
According to crypto analyst Mister Crypto, the 3-week MACD has turned bearish. The MACD line has moved below the signal line—a setup many traders watch for changes in longer-term trend direction. Bitcoin is now trading at $103,850, down 3% over the past 24 hours and 9% in the last seven days.
A similar signal appeared in late 2021, followed by a major decline in BTC’s price. The latest chart also shows bearish divergence: the asset made a new high while the MACD histogram posted a lower high. Mister Crypto described the signal as “another bearish signal for Bitcoin,” reflecting caution across the market.
Moreover, Bitcoin is now trading below its 50-day, 100-day, and 200-day exponential moving averages. The 50-day stands at $112,140, the 100-day at $108,350, and the 200-day at $112,180. The gap between the 50-day and 100-day averages has narrowed, with a potential crossover approaching. The price holding steady under all three levels reflects continued weakness in the trend.
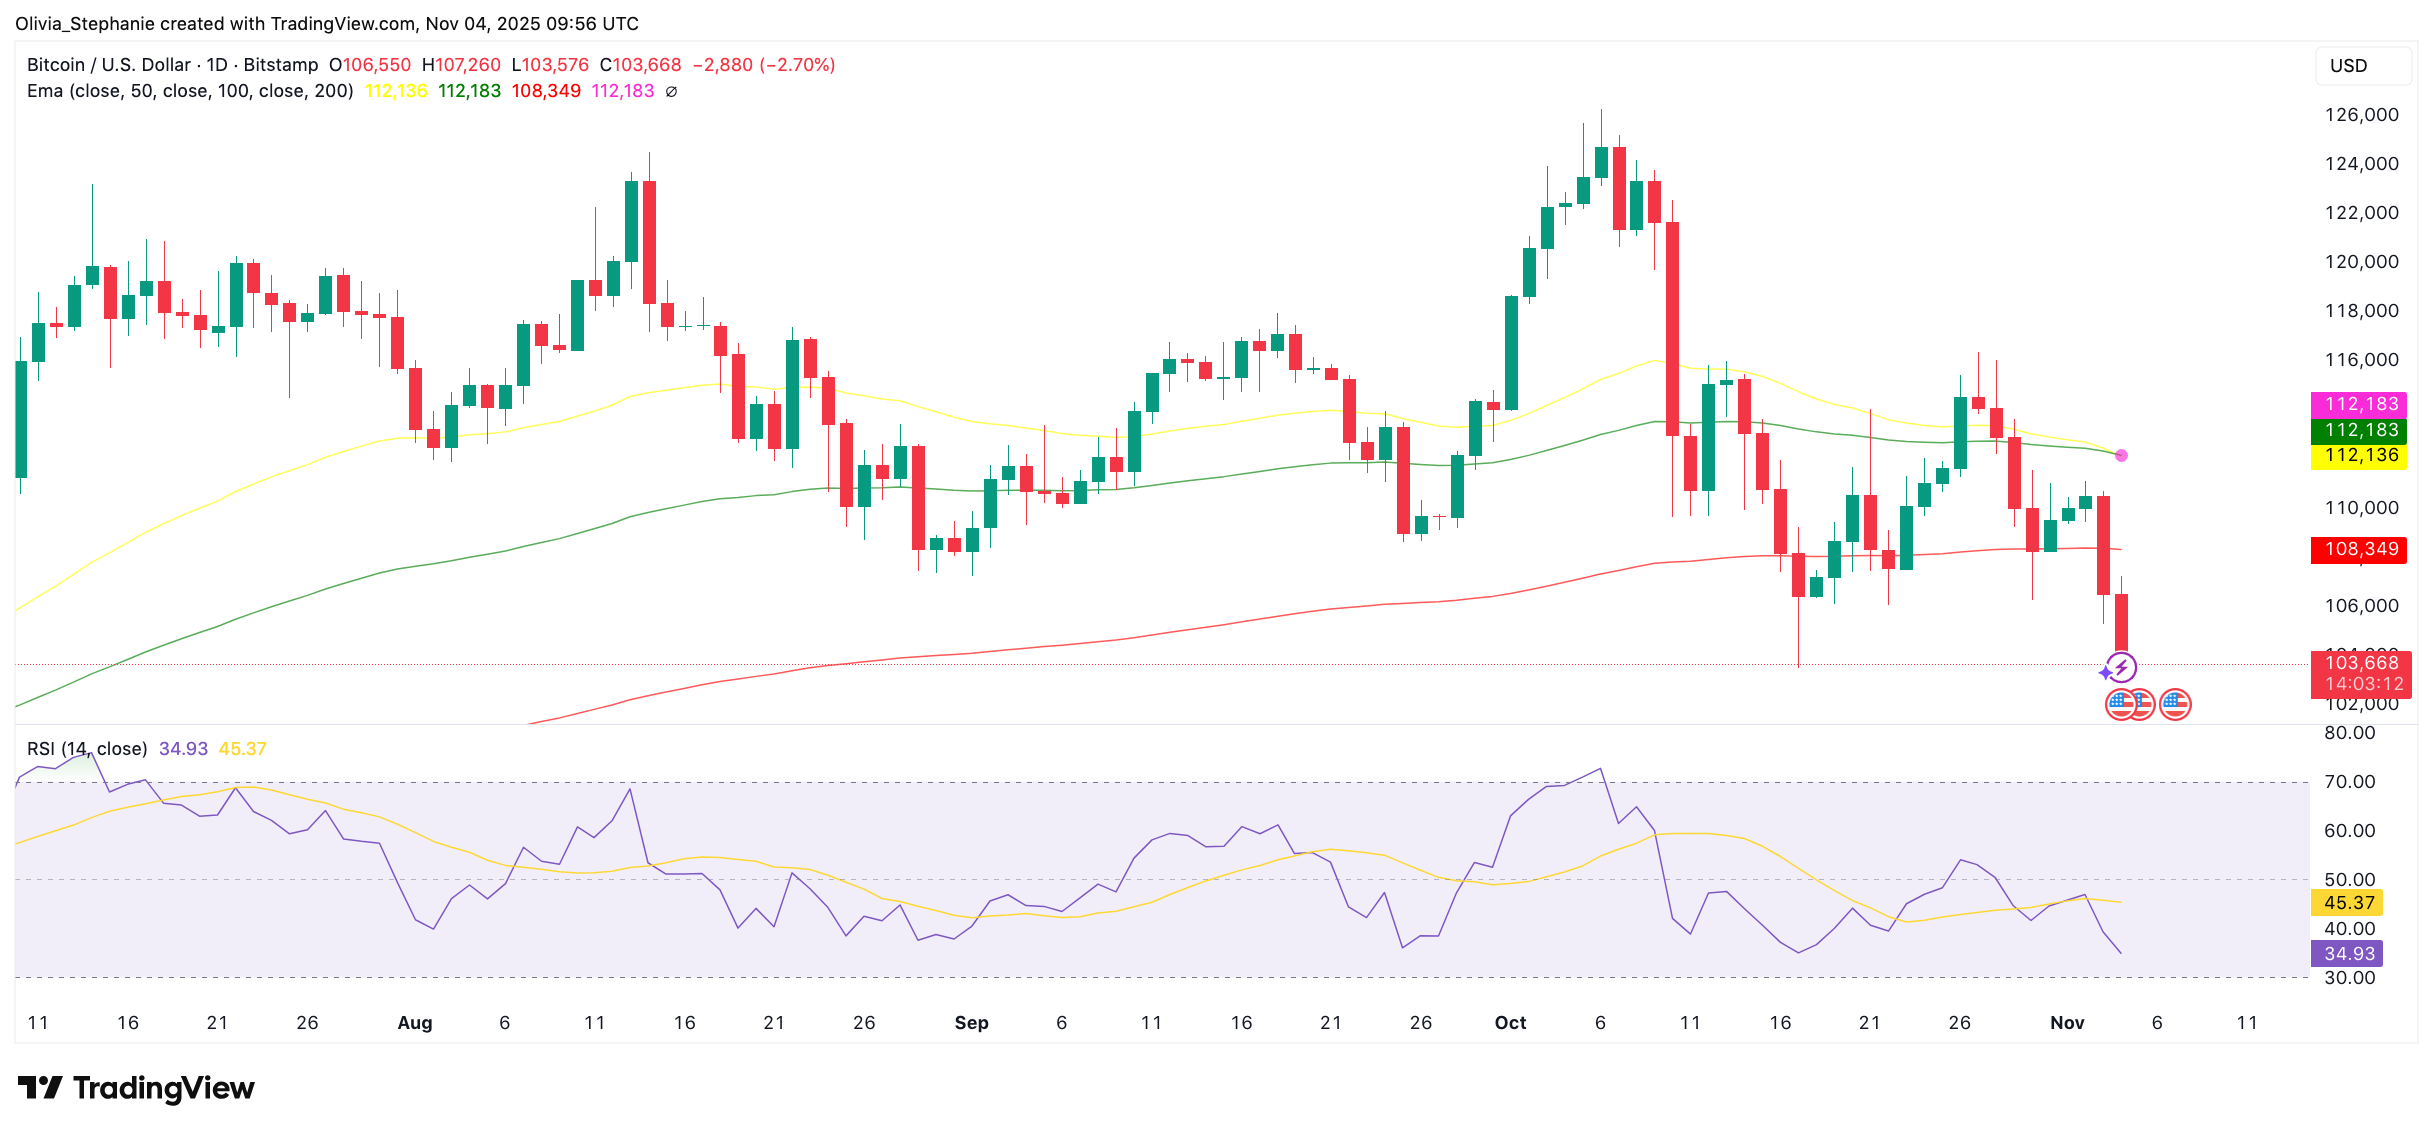 Source: TradingView
In addition to the moving averages, momentum indicators are also showing weakness. The Relative Strength Index (RSI) has dropped to 35, which is nearing oversold territory. The indicator remains below its signal line, pointing to sustained selling pressure. Traders often see this level as a potential area for a short-term bounce—provided that buying interest returns.
Volatility Narrows, Liquidity Builds Below
Recent analysis suggests that Bitcoin has repeatedly held above a key technical support level during market corrections. The price recently tested this zone again near $100,500 before rebounding. A monthly close below it could signal a trend shift.
Analyst Cryptoinsightuk said that “liquidity is building between $91,000 and $98,000” and that “this type of structure tends to get taken roughly 80% of the time.” They added that there is also a “slightly more dense pocket above us around $102,000.” These zones are often targeted during large price movements, especially in algorithm-driven markets.
Analysts Monitor Key Support Around $100K
Crypto analyst Ted warned that Bitcoin is “in absolute free fall” and added, “There’s no strong support until the $100,000 level.” He also mentioned the $92,000 area as the next possible target due to an open CME futures gap.
Data from CryptoQuant shows that US investor demand has cooled in recent weeks. Although self-custody activity has increased, early buying has not shown strong follow-through, as CryptoPotato reported. Without renewed demand, analysts suggest that downside risk may remain elevated in the short term.
The post Another Bitcoin (BTC) Warning Sign? MACD Flashes Bearish, Price Falls appeared first on CryptoPotato.


추천 콘텐츠

Crypto Hack: Drift Protocol Drained Over $200M in Private Key Breach

The Ticketing Industry Is Breaking. Omar Sarieddine and Ticmint Are Betting on What Comes Next