Dogecoin (DOGE) is now experiencing some signs of relief as price pressures have receded recently. Analysts say that DOGE has probably reached a temporary bottom based on technical indicators, and this may be an indication that a price recovery is forthcoming for this cryptocurrency. Support levels are being closely monitored as signs of rallies are […]Dogecoin (DOGE) is now experiencing some signs of relief as price pressures have receded recently. Analysts say that DOGE has probably reached a temporary bottom based on technical indicators, and this may be an indication that a price recovery is forthcoming for this cryptocurrency. Support levels are being closely monitored as signs of rallies are […]

Dogecoin Price Shows Early Signs of Rebound Toward $0.17

2025/11/06 23:00
3분 읽기
이 콘텐츠에 대한 의견이나 우려 사항이 있으시면 crypto.news@mexc.com으로 연락주시기 바랍니다
Dogecoin
  • Dogecoin shows early signs of a rebound as technical indicators suggest a local bottom formation.
  • Analysts eye a potential move toward $0.17 if DOGE maintains its key support zones.
  • RSI remains near oversold levels while MACD and moving averages still signal weak momentum.

Dogecoin (DOGE) is now experiencing some signs of relief as price pressures have receded recently. Analysts say that DOGE has probably reached a temporary bottom based on technical indicators, and this may be an indication that a price recovery is forthcoming for this cryptocurrency. Support levels are being closely monitored as signs of rallies are sought.

Dogecoin Eyes Strong Recovery Ahead

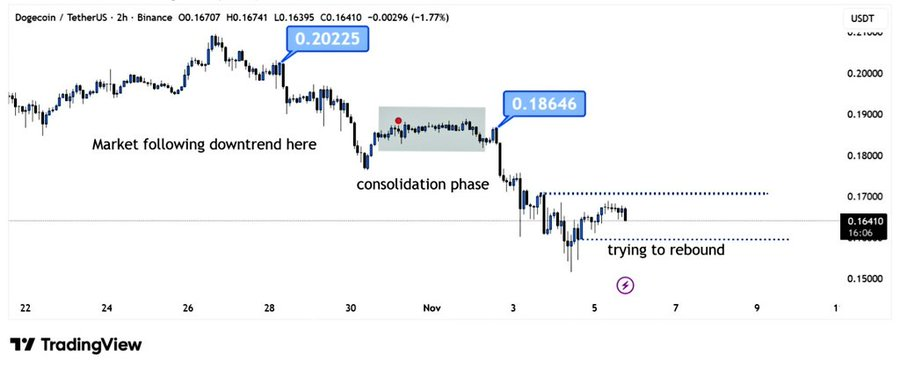
Crypto analyst BitGuru explained that Dogecoin previously reached its peak at about $0.20 before dropping into a downtrend. Later, the cryptocurrency switched into a period of consolidation at about $0.186.

Source: X

Today, however, Dogecoin is currently testing its support at around $0.164 and may follow through into its target of about $0.17 if the support is intact, opening space for a potential strong recovery and a boost of investor sentiment.

At press time, DOGE is trading at $0.1638, having a trading volume of $4.10 billion and a market capitalization of $24.84 billion within the last 24 hours. In this period, DOGE has shown a small growth of 0.22% over the last 24 hours.

image.pngSource: CoinMarketCap

Dogecoin Signals Local Bottom Recovery

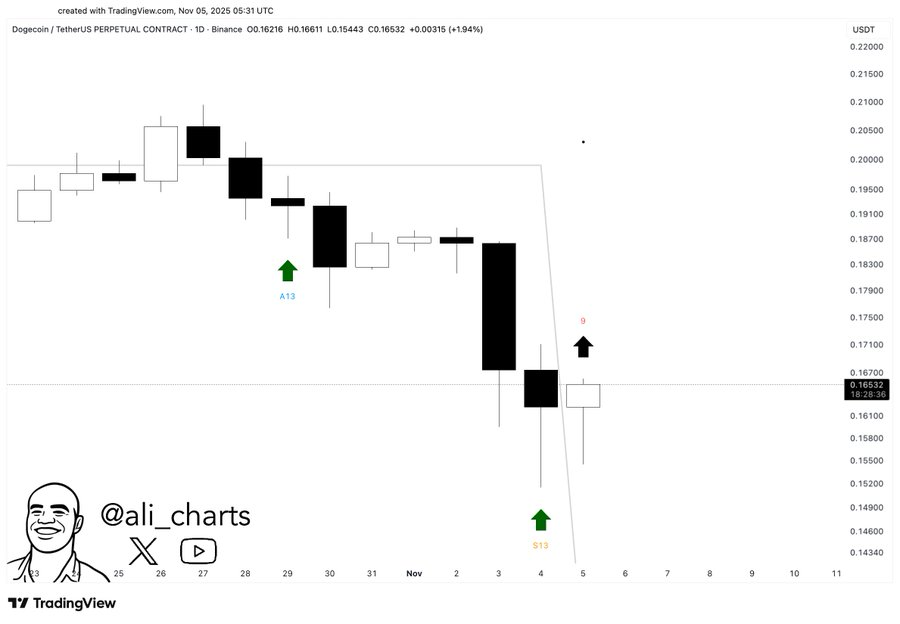
Adding more positivity to this, technical analyst Ali Martinez has highlighted that technical indicators, including TD Sequential, are giving buy signals for Dogecoin. According to Ali Martinez, this could be an indication that the local bottom has been reached, and a recovery phase is expected.

Source: X

Although it is always imperative to exercise caution, especially when it comes to trading on the cryptocurrency market, it would seem that Dogecoin has finally stabilized following a period of downward trend, as indicated by its recent behavior on the market.

As Dogecoin has again received renewed attention and technical indicators are suggesting recovery, this digital currency may witness more buying if it holds on to its present supports.

Also Read | Dogecoin (DOGE) Builds Momentum: Can November Spark the Next Rally?

Dogecoin Shows Weak Momentum

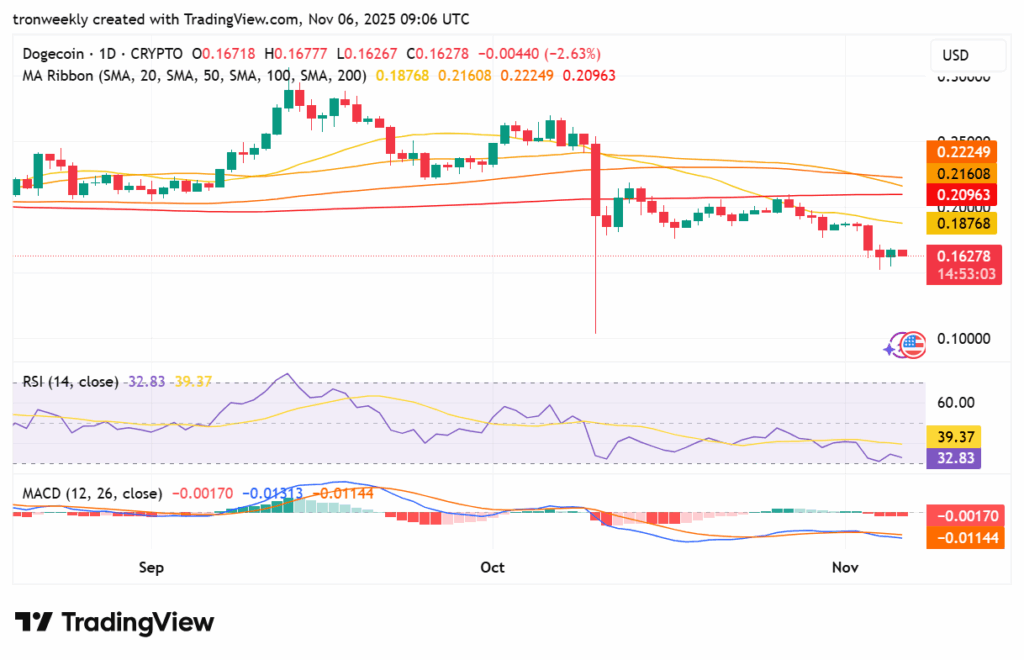
The value of RSI is calculated to be 32.83, near the oversold region, and the signal is held at 39.37, indicating weak buying momentum. The MA Ribbon is still indicating a bearish trend, as all candles are placed below the averages of 20, 50, 100, and 200 days, with values of 0.18768, 0.20963, 0.21608, and 0.22249, respectively, indicating that the trend is dominated by.

Source: TradingView

MACD is again indicating support for the bears, as MACD is at -0.01144, below the Signal Line of -0.00170. Again, the histogram depicts red color, indicating that DOGE could be experiencing downward motion as more red colors continue to appear on the histogram until a bearish crossover is observed.

Also Read | Whales Offload 1 Billion Dogecoin, DOGE Struggles Below $0.17 Resistance

시장 기회
도지 로고
도지 가격(DOGE)
$0.09059
$0.09059$0.09059
-2.41%
USD
도지 (DOGE) 실시간 가격 차트
면책 조항: 본 사이트에 재게시된 글들은 공개 플랫폼에서 가져온 것으로 정보 제공 목적으로만 제공됩니다. 이는 반드시 MEXC의 견해를 반영하는 것은 아닙니다. 모든 권리는 원저자에게 있습니다. 제3자의 권리를 침해하는 콘텐츠가 있다고 판단될 경우, crypto.news@mexc.com으로 연락하여 삭제 요청을 해주시기 바랍니다. MEXC는 콘텐츠의 정확성, 완전성 또는 시의적절성에 대해 어떠한 보증도 하지 않으며, 제공된 정보에 기반하여 취해진 어떠한 조치에 대해서도 책임을 지지 않습니다. 본 콘텐츠는 금융, 법률 또는 기타 전문적인 조언을 구성하지 않으며, MEXC의 추천이나 보증으로 간주되어서는 안 됩니다.

추천 콘텐츠

Riot Sells 500 BTC for $34.87 Million

Riot Sells 500 BTC for $34.87 Million

Riot Platforms has sold another 500 BTC worth approximately $34.87 million, bringing its total sales to 1,500 BTC—over $102 million—in just five days. Moves of
공유하기
Coinfomania2026/04/07 19:02
Edges higher ahead of BoC-Fed policy outcome

Edges higher ahead of BoC-Fed policy outcome

The post Edges higher ahead of BoC-Fed policy outcome appeared on BitcoinEthereumNews.com. USD/CAD gains marginally to near 1.3760 ahead of monetary policy announcements by the Fed and the BoC. Both the Fed and the BoC are expected to lower interest rates. USD/CAD forms a Head and Shoulder chart pattern. The USD/CAD pair ticks up to near 1.3760 during the late European session on Wednesday. The Loonie pair gains marginally ahead of monetary policy outcomes by the Bank of Canada (BoC) and the Federal Reserve (Fed) during New York trading hours. Both the BoC and the Fed are expected to cut interest rates amid mounting labor market conditions in their respective economies. Inflationary pressures in the Canadian economy have cooled down, emerging as another reason behind the BoC’s dovish expectations. However, the Fed is expected to start the monetary-easing campaign despite the United States (US) inflation remaining higher. Investors will closely monitor press conferences from both Fed Chair Jerome Powell and BoC Governor Tiff Macklem to get cues about whether there will be more interest rate cuts in the remainder of the year. According to analysts from Barclays, the Fed’s latest median projections for interest rates are likely to call for three interest rate cuts by 2025. Ahead of the Fed’s monetary policy, the US Dollar Index (DXY), which tracks the Greenback’s value against six major currencies, holds onto Tuesday’s losses near 96.60. USD/CAD forms a Head and Shoulder chart pattern, which indicates a bearish reversal. The neckline of the above-mentioned chart pattern is plotted near 1.3715. The near-term trend of the pair remains bearish as it stays below the 20-day Exponential Moving Average (EMA), which trades around 1.3800. The 14-day Relative Strength Index (RSI) slides to near 40.00. A fresh bearish momentum would emerge if the RSI falls below that level. Going forward, the asset could slide towards the round level of…
공유하기
BitcoinEthereumNews2025/09/18 01:23
Polymarket Expands Into Stocks and Commodities With Pyth-Powered Pricing

Polymarket Expands Into Stocks and Commodities With Pyth-Powered Pricing

Polymarket launched daily equity and commodity markets powered by Pyth Network's real-time price feeds, expanding prediction trading into traditional finance. The
공유하기
Cryptonews AU2026/04/03 13:52

$30,000 in PRL + 15,000 USDT

$30,000 in PRL + 15,000 USDT$30,000 in PRL + 15,000 USDT

Deposit & trade PRL to boost your rewards!