

The Crucial Resistance That Will Decide Bitcoin’s Next Major Move
Bitcoin (BTC) is trading near $105,000 after falling below the $107,000 support level. This area had held since April 2025 but turned into resistance during the recent decline.
Meanwhile, the market is watching this level as the asset attempts to recover. Activity has picked up following renewed optimism around the US government avoiding a shutdown, which has supported risk markets.
Technical Resistance at $107K
Daan Crypto Trades reported that BTC lost both the 200-day moving average (MA) and the 200-day exponential moving average (EMA) after holding above them for months. These indicators now converge near $107,000, making it a key resistance zone.
The current trend is down, with BTC trading below both moving averages. The recent attempt to reclaim $107,000 was met with rejection. Until the price breaks and holds above this zone, downward pressure remains.
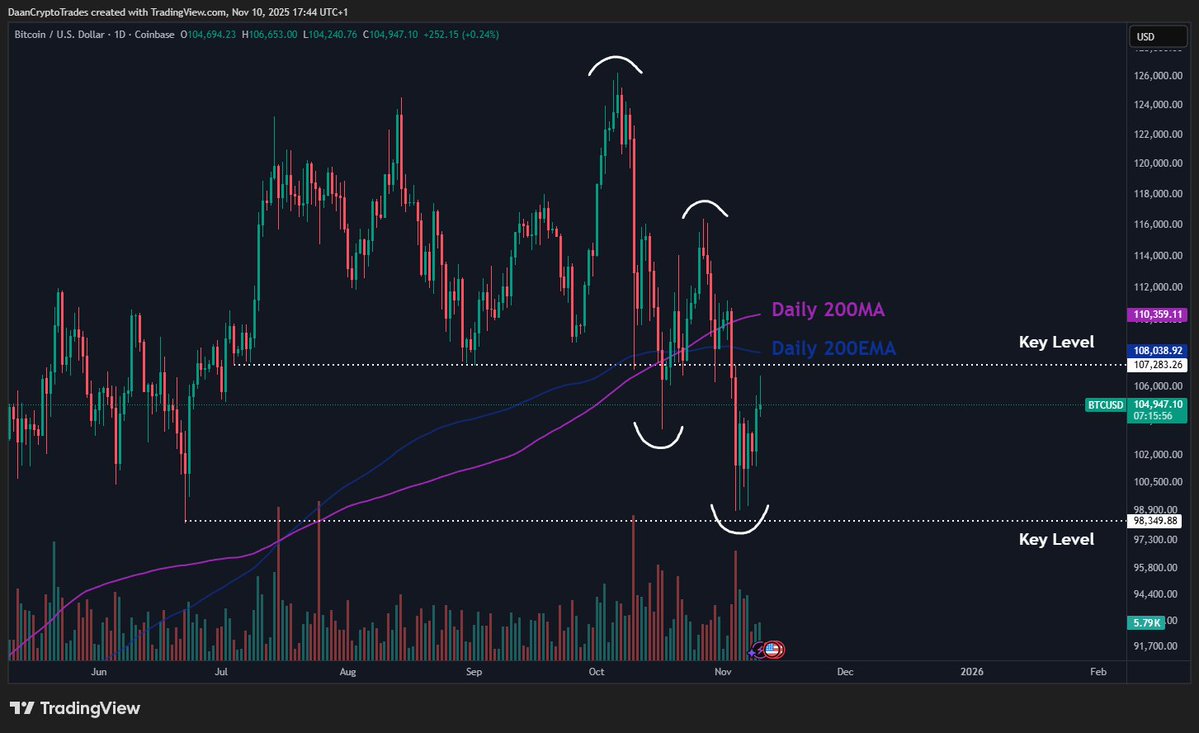 Source: Daan Crypto Trades/X
However, on a broader timeframe, structural support remains intact. Crypto Patel noted that BTC closed the weekly candle above the 50-week EMA. This level has provided support since 2023 and has been tested multiple times without breaking.
In addition, the chart also shows an unfilled fair value gap (FVG) of around $90,000. Previous gaps have been filled during the uptrend, but this one remains open. Referring to the importance of this support, Crypto Patel said,
Liquidity Levels and Short-Term Moves
Bull Bear Spot posted that BTC cleared most liquidity above current levels. The area below $104,950 is still active and may attract price movement.
Ted shared that BTC has shown a pattern of peaking on Mondays and forming lows on Tuesdays. He also pointed to a CME gap around $104,000, which remains open.
Long-Term Signals and Market Timing
In a video, Ali Martinez mentioned that past Bitcoin cycles peaked 1,064 days after major bottoms. The recent high of $126,000 came exactly 1,064 days after the November 2022 low. He said, “This suggests that the market top may be in.” The remark is based on past cycle duration but does not predict future moves.
Doctor Profit noted BTC is near the “Golden Line” at $99,200, as previously reported. This level has held since March 2023. ETF data also shows weekly outflows, indicating reduced institutional activity. Bitcoin remains active around critical price zones.
The post The Crucial Resistance That Will Decide Bitcoin’s Next Major Move appeared first on CryptoPotato.


추천 콘텐츠

The Role of Reference Points in Achieving Equilibrium Efficiency in Fair and Socially Just Economies

CoinRabbit Reduces Crypto Lending Rates for XRP Loans and 300+ Assets


