

Dogecoin Whales Load Up: 4.72 Billion DOGE Vanish Into Mega Wallets
Dogecoin’s largest non-exchange holders have accelerated accumulation into early November even as price remains subdued, according to a Santiment chart shared by crypto analyst Ali Martinez.
Dogecoin Whale Holdings Jump By 4.72B DOGE
The graphic tracks two series from August 11 through November 12, 2025: DOGE’s spot price (black line, right-axis in USD) and the aggregate holdings of addresses with 100 million to 1 billion DOGE (shaded area, right-axis in coins). Over the most recent two-week window the whale cohort added roughly 4.72 billion DOGE, lifting their stack to about 32.4 billion coins at the latest reading.
Price action over the same period shows a clear loss of momentum from the late-summer rally. After a mid-September push that printed near the top axis mark around $0.30, DOGE rolled over into a sequence of lower highs through early October before a sharp mid-October drawdown.
The line carves out a capitulation through close to the $0.16 gridline in early November, followed by an anemic rebound that stalled beneath successive axis bands and slipped again into early November. The final plot on November 12 sits near $0.175, noticeably below the September peak and still hugging the lower bound of the chart’s labeled range.
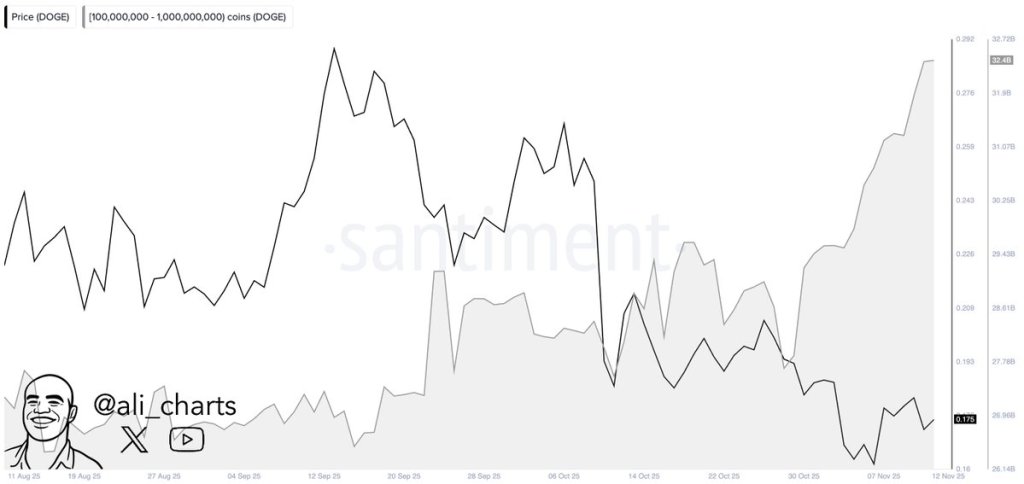
Against that backdrop, the whale series presents a contrasting staircase. Holdings were comparatively flat and choppy through September, with brief step-ups around late September and early October that quickly faded.
The decisive move began in the final days of October: the shaded area arcs higher in a near-continuous climb from the ~27.7 billion region toward 32.4 billion by November 12. The magnitude of that rise aligns with Martinez’s note of 4.72 billion DOGE accumulated in roughly two weeks, concentrated entirely within the 100M–1B address tranche ($17.5 – $175 million at current price) specified on the chart.
The juxtaposition establishes a straightforward divergence: while price traced new local lows into late October and struggled to reclaim lost ground in early November, large holders expanded their positions and now control the highest share shown on the display period.
The chart does not attribute causality or forecast direction, but it clearly documents where flows have been concentrated. Key price landmarks on the panel remain the mid-September swing high near $0.30 and the late-October low near $0.16.
DOGE Bulls Must Act Now
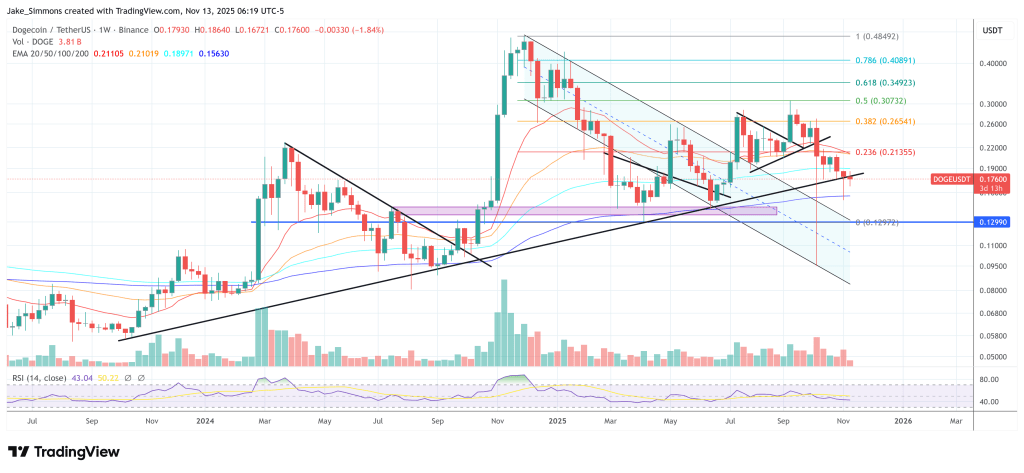
On the weekly DOGE/USDT chart, price is still trading below the rising black trendline that supported the advance from October 2023 until the clear breakdown in early November 2025, and that line now acts as overhead resistance in the upper-$0.18 area.
DOGE is currently around $0.1766, capped beneath the 0.236 Fibonacci retracement at $0.2136 and the 20/50-week EMAs clustered near $0.2111–$0.2102, while resting above the 200-week EMA at $0.1563 and the major horizontal support highlighted near $0.1299.
Until the market can reclaim that former primary uptrend line on a weekly basis, the chart structure remains one of post-breakdown retests from below, with key upside reference levels marked at the trendline itself, then $0.2136 (0.236 Fib), and higher Fibonacci checkpoints at $0.2654, $0.3073, $0.3492 and $0.4089
Featured image created with DALL.E, chart from TradingView.com


추천 콘텐츠

Donald Trump Has Made More Statements Escalating Tensions Against Iran – “One Night Is Enough for the Whole Country”

Datavault AI to Present RWA Tokenization Technologies at XRP Tokyo 2026, Targeting Japan’s Regulatory-Friendly Market


