

Bitcoin Tests Key Support as Bearish Momentum Deepens and Long-Term Holders Unload 815K BTC: CryptoQuant
Bitcoin’s momentum has weakened sharply, and the market has slipped into one of its most bearish phases of the year, according to the latest CryptoQuant weekly report.
Sentiment has deteriorated quickly as Bitcoin hovers dangerously close to the $100,000 level. The shift began after the October 10 “Big Liquidation” event, which drained upward momentum and pushed several key indicators into bearish territory.
Spot demand contracted earlier in October, while growth in stablecoin liquidity—a key driver of market inflows—slowed sharply. Together, these factors have created a fragile environment in which Bitcoin’s price struggles to sustain meaningful support.
A Market Losing Its Grip on Momentum
CryptoQuant’s Bull Score Index reflects the extent of the downturn. Earlier in October, when Bitcoin reached its all-time high of $126,000, the index stood at a strongly optimistic reading of 80. That optimism evaporated quickly as Bitcoin slipped below $100,000 for the first time since June.
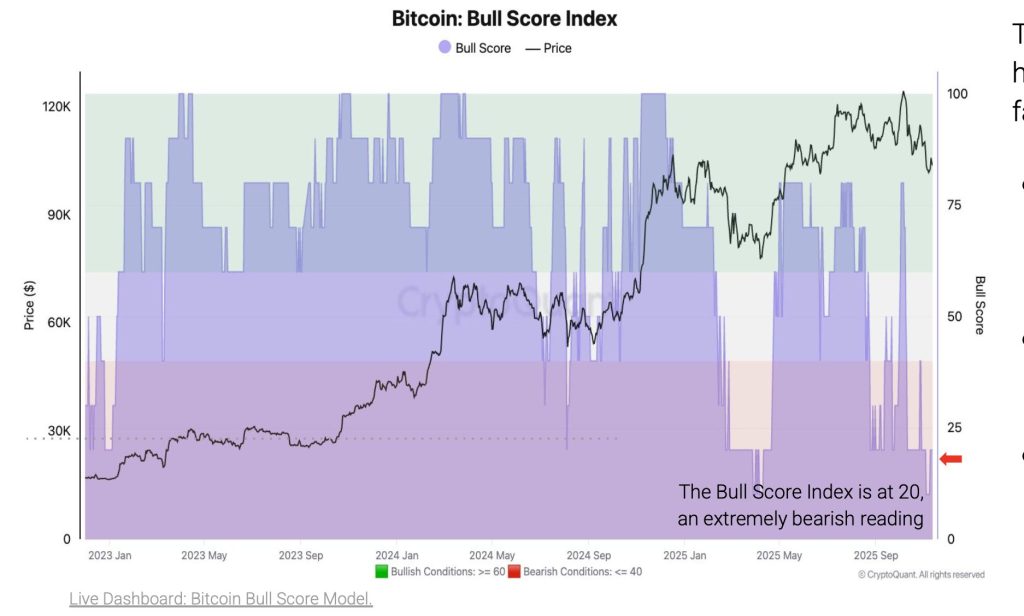
The index has now fallen to 20, indicating an extremely bearish environment. The steep decline shows how quickly the market has shifted from aggressive buying to hesitation and caution, with fewer new inflows and weaker spot demand contributing to the downward pressure.
Long-Term Holders Unload at Rare Levels
One of the most concerning signs in the report is the behaviour of long-term holders. Over the past month, they have sold roughly 815,000 BTC, marking their heaviest distribution since January 2024. This selling occurred as Bitcoin pushed into the $118,000 to $121,000 range, a moment when spot demand had already begun to fade.
In earlier phases of the cycle, strong demand from ETFs, institutional traders, and retail buyers was sufficient to absorb heavy selling from long-term holders. That buffer is now absent. Instead, the combination of steady supply from long-term holders and weakening demand is placing clear downward pressure on the market, raising the risk of further price deterioration.
Profit-Taking Stays Strong, but Capitulation Is Absent
Profit realization remains elevated. On November 7, investors locked in approximately $3 billion in net profits, mirroring the aggressive selling seen throughout October. Despite the heavy profit-taking, the market has yet to show signs of capitulation.
Realized losses remain extremely low, suggesting that holders are not panic-selling even as price support weakens. This dynamic—strong profits but minimal losses—indicates that the market has not formed a bottom. Historically, price floors emerge only after losses rise and weak hands exit the market, a pattern that has not yet appeared.
The Battle at the 365-Day Moving Average
Bitcoin’s current struggle centres on the 365-day moving average, which sits near $102,000. This line has served as the ultimate support level throughout the current bull cycle and was one of the last major indicators to turn bearish during the 2021–2022 transition into a prolonged downturn.
Bitcoin has now dipped below this level several times—a warning sign not seen earlier in this cycle. If the price continues to close beneath the 365-day average, the risk of a deeper correction grows considerably.
CryptoQuant notes that the next areas of meaningful support lie lower, suggesting that failure to reclaim this moving average could accelerate a broader market decline.
Bitcoin now stands at a key juncture. With momentum fading, long-term holders selling heavily, and spot demand failing to keep pace, the market’s ability to stabilize depends heavily on whether Bitcoin can reclaim its 365-day moving average. The coming weeks may determine whether this is a temporary pullback or the start of a more severe correction.


추천 콘텐츠

FOMC Minutes Signal Fed Rate Cuts Still Possible as Iran War Poses Dual Risks

USD/JPY pulls back to 158.50 on Iran ceasefire optimism


