

Here’s why the XRP price may crash below $1 soon
XRP price continued its downward momentum on Monday as it crashed below the important support level at $2.
Ripple (XRP) has declined for five consecutive days, marking its longest losing streak in over a month, and is now trading at its lowest level since April 11. The token has plunged over 40% from its yearly high, and technicals suggest a potential drop below the $1 mark.
XRP has fallen due to three key factors. First, the U.S. Securities and Exchange Commission delayed its decision on the Franklin Templeton XRP ETF last week, citing the need for further analysis.
On the positive side, some crypto traders still expect the agency to approve a spot XRP ETF later this year. According to Polymarket, the odds of approval by year-end stand at over 80%.
Second, XRP has been caught in the broader crypto market crash driven by rising geopolitical tensions in the Middle East. This crisis has triggered a correction in Bitcoin (BTC) and pushed many altcoins into bear market territory.
Third, the XRP Ledger continues to struggle within the decentralized finance space. On-chain data shows that the total value locked has dropped over 12.5% in the past 30 days to $54.2 million. Its stablecoin supply stands at $71 million, much lower than newer chains like Sonic and Berachain.
XRP price technical analysis points to a crash
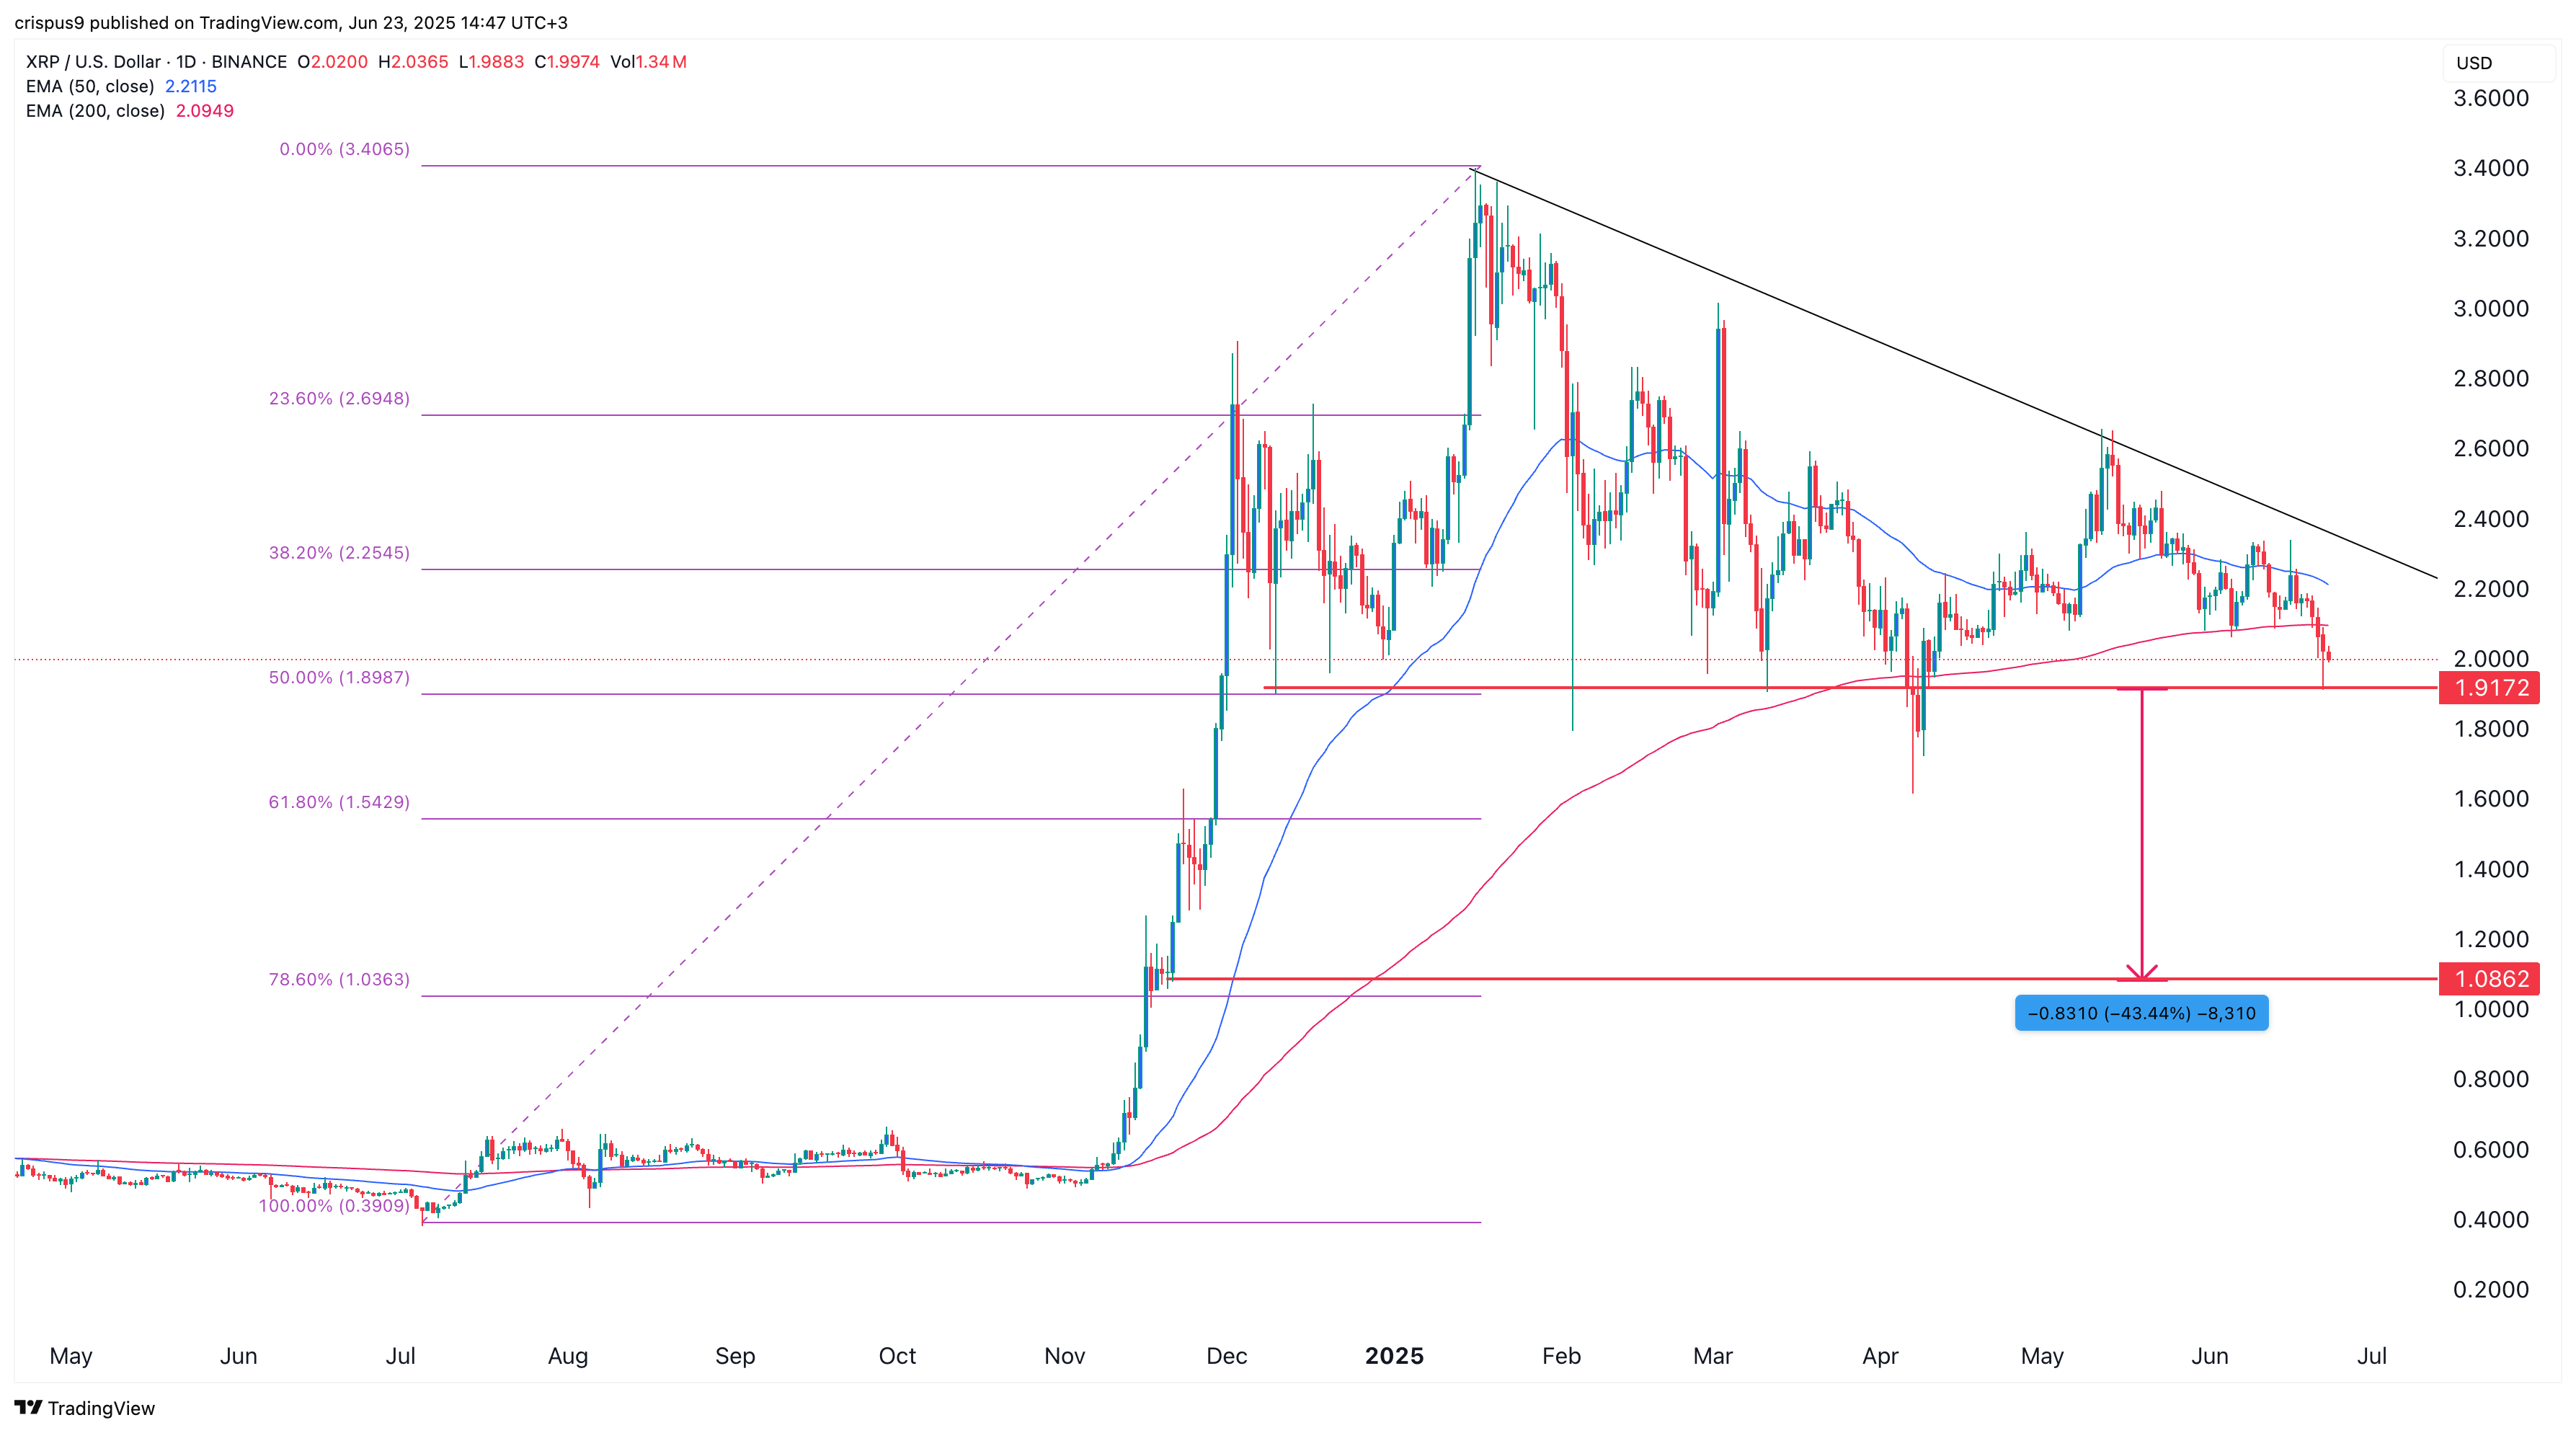 XRP price chart | Source: crypto.news
The daily chart shows that XRP has been in a sustained downtrend over the past few months, dropping from $3.40 in January to around $2 today.
The token has now reached the 50% Fibonacci retracement level at $1.8990, representing a 45% decline from this year’s peak. It has also fallen below both the 50-day and 200-day Exponential Moving Averages.
Most notably, XRP has formed a descending triangle pattern, a classic bearish continuation setup. Historically, this pattern often leads to further downside once the lower support level is breached.
The price target for a descending triangle is calculated by measuring the height of the triangle at its widest point and projecting that distance downward from the breakdown level.
In this case, the projected move implies a 43% drop from the triangle’s base, setting a target near $1.08. A drop below that level would increase the probability of XRP falling below the key psychological threshold at $1.
However, a move above the $2.20 resistance level would invalidate the bearish outlook and suggest the potential for further gains.


추천 콘텐츠

XRP Price Prediction: Is $8.00 Still Possible After the Standard Chartered Slash? AlphaPepe Offers a High-Speed 150x Alternative

Trump says US blockade of Hormuz ends with agreement signing


