

Is The Bitcoin Bottom In? Fidelity Research Lead Weighs The Odds

Bitcoin’s sell-off this week has reignited the question of whether the market has already printed a local bottom. Chris Kuiper, CFA, VP of Research at Fidelity Digital Assets, argues that several on-chain and sentiment gauges now resemble prior bull-market corrections, while stressing that nothing is certain.
“I as well as anyone never knows for sure,” Kuiper wrote on X, “but one chart I do like to use to help gauge the probabilities is the short-term holder MVRV chart along with their cost basis.”
Is The Bitcoin Bottom In?
The Glassnode chart he shared tracks Bitcoin against the realized price of short-term holders (STHs) and their MVRV ratio – a measure of whether this cohort is in aggregate profit or loss. In previous uptrends, local lows have often occurred when STH MVRV dipped below 1, briefly putting recent buyers underwater before price recovered.
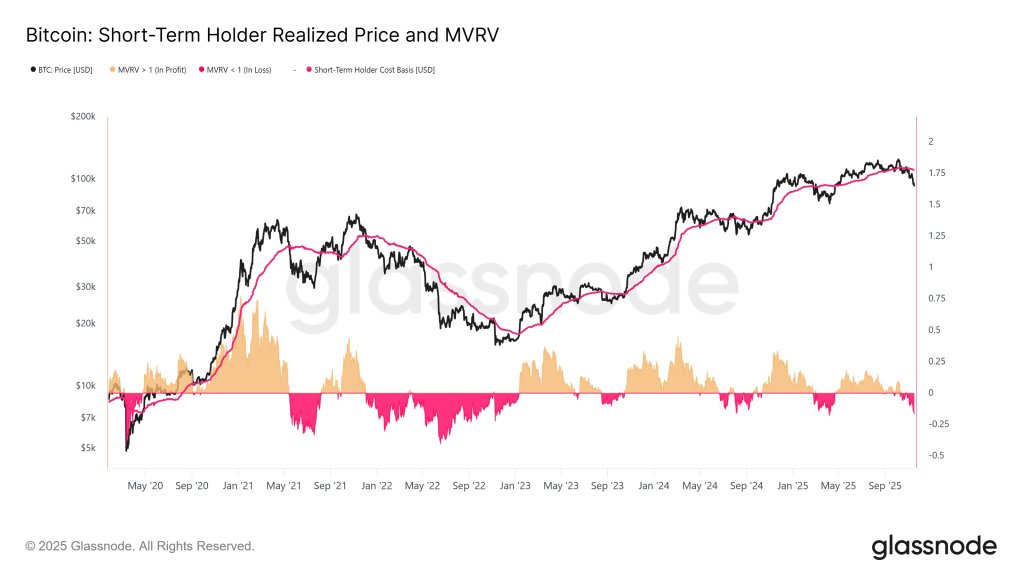
Kuiper notes that the current drawdown has pushed STHs back into loss territory in a way that looks similar to earlier mid-cycle pullbacks. “If this indeed is a regular 20–30% drawdown within the current bull market, then the MVRV ratio is showing a similar valley as before, testing the mettle of short-term holders before resetting to move higher,” he wrote.
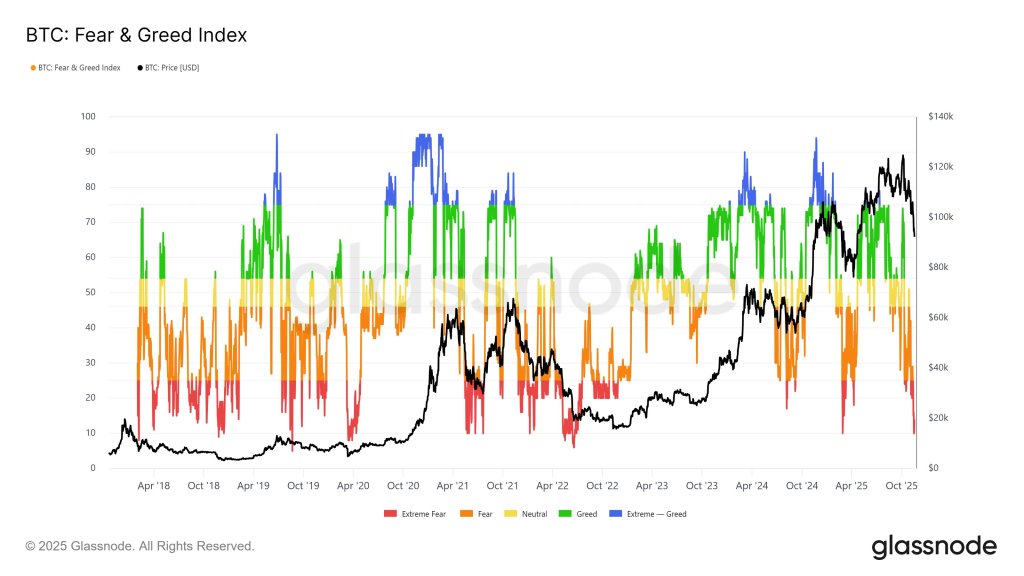
His second reference point is the Bitcoin Fear & Greed Index, which has swung from sustained “greed” and “extreme greed” back into “fear,” with episodes of “extreme fear.” According to Kuiper, the index “tends to hit extreme levels at these local tops and bottoms,” suggesting sentiment has reset after the recent euphoria. Currently, the index sits at 11.
“This is not a prediction,” he cautioned, “but given the lack of negative fundamental news or changes (and in fact the opposite lately), this data tips my assessed probabilities in favor of this being a regular and healthy drawdown.”
Other analysts are more cautious. Bitwise senior research associate Max Shannon flagged “further possible downside re. correlation to equity markets, lower Dec rate cut prob., LTH continue selling in BTCs ‘IPO moment’.” Still, he added that “risk-return profiles [are] improving at these levels imo. Things are stretched and lots of contrarian indicators flashing green.”
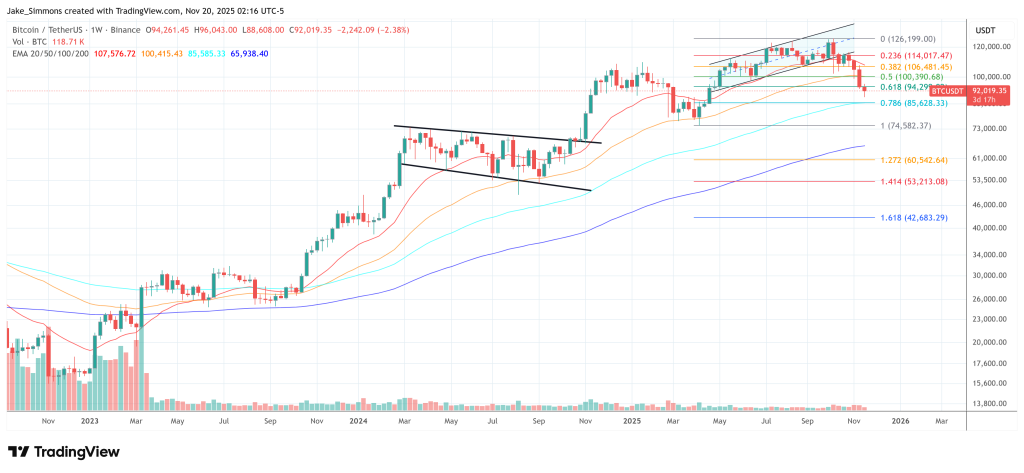
Crypto investor Richard Haas pointed to a deviation from earlier bull-market corrections, warning that “prior bull corrections never closed more than 10% below the 200ma cloud, and never let the 50dma curl down.”
For now, Kuiper’s view is that on-chain stress among short-term holders and a sharp sentiment reset are consistent with a typical bull-market shakeout. Whether that marks a durable bottom or only a pause in further downside remains unresolved – and, as he emphasizes, ultimately comes down to probabilities, not certainties.
At press time, BTC traded at $92,019.


추천 콘텐츠

XRP Price About to Explode? This Setup Says Yes
USD/JPY Intervention Alert: Critical 160 Level Raises Stakes for Bank of Japan


