

Dogecoin DOGE outlook: can bears keep control below $0.15?
 Dogecoin (DOGE) is trading in a fragile spot, with the token hovering near the lower end of its recent range while broader crypto sentiment deteriorates.
In this piece we look at where the market stands now, which forces are driving the move, and what the next decisive steps could be for the meme giant against USDT.
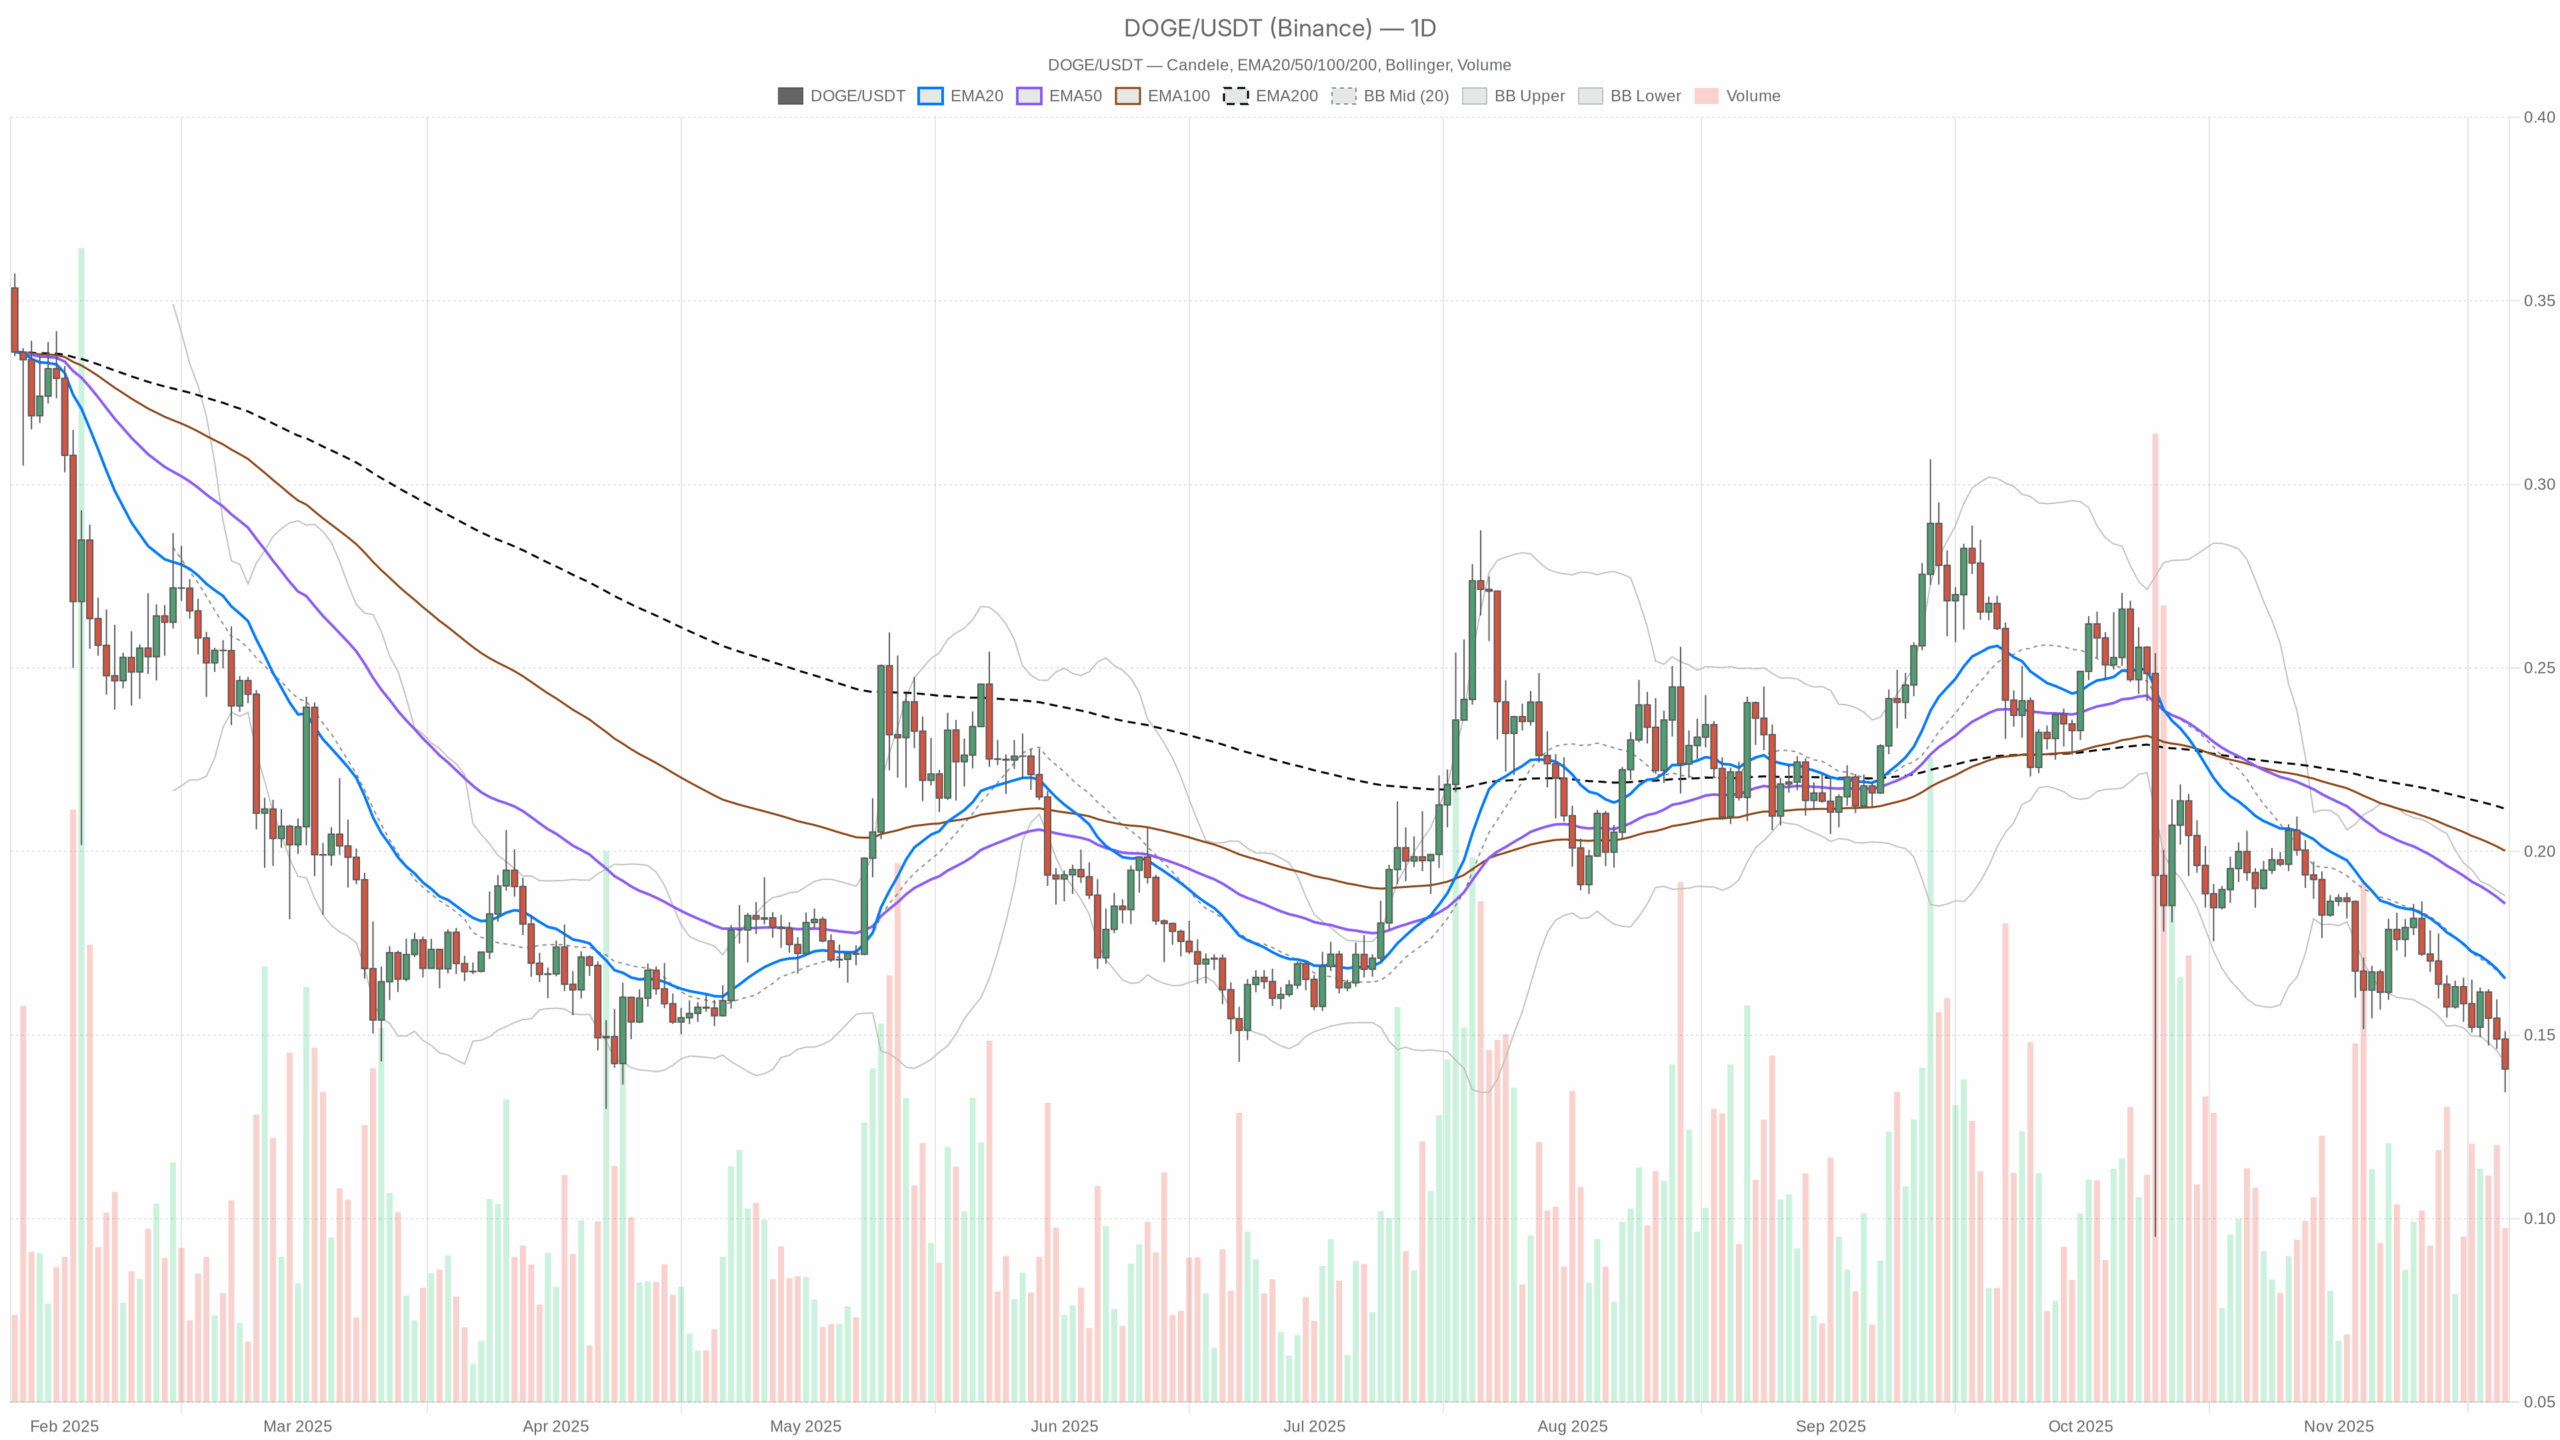 DOGE/USDT — daily chart with candlesticks, EMA20/EMA50 and volume.
Summary
The daily setup shows a clear bearish market regime, with price at 0.14, sitting well below the 20, 50 and 200-day EMAs. Momentum indicators lean negative, as the daily RSI is in the low 30s, close to oversold territory, reflecting persistent selling pressure rather than panic capitulation.
MACD is slightly negative but flat, pointing to momentum exhaustion rather than aggressive trend acceleration. Volatility is moderate, with the Bollinger Bands lower boundary close to spot price, suggesting limited room before a potential bounce or short squeeze.
Meanwhile, the wider market has just suffered an 8% drop in total capitalization over 24 hours, and investors are in “Extreme Fear” according to the Fear & Greed Index. Overall, this backdrop encourages caution, but it also opens the door to sharp countertrend rallies if sentiment stabilizes.
Dogecoin DOGE: Market Context and Direction
The broader crypto environment is clearly risk-off. The total market capitalization stands around 2.95 trillion dollars, but it has fallen by roughly 8% in the last day, underscoring a rapid risk repricing across the board.
Bitcoin dominance is near 56.4%, which indicates that capital is clustering in the market leader while altcoins lag behind. Moreover, when BTC captures more than half of the market, liquidity tends to drain from speculative assets like this meme token.
The macro sentiment picture reinforces this caution. The Fear & Greed Index sits at 14, firmly in “Extreme Fear” territory.
That said, such conditions often coincide with late stages of a downside move, where forced sellers have already acted and marginal new selling becomes harder to sustain. In contrast, aggressive new long exposure usually waits for signs of stabilization or a clear technical trigger, which we do not fully have yet on the daily chart.
Technical Outlook: reading the overall setup
On the daily timeframe, the token closes at 0.14, while the 20, 50 and 200-day EMAs cluster between 0.17 and 0.21. This wide gap below all three moving averages reveals dominant downside control and a firmly bearish trend structure. As long as price remains under the 20-day EMA near 0.17, any bounce is more likely to be a reaction within a downtrend than the start of a sustainable reversal.
The daily RSI at about 32 underscores this view. It is not yet in extreme oversold territory, but it is close enough to show that sellers have been in charge for a while. However, because RSI is not deeply below 30, it hints at grinding weakness rather than a capitulation washout. That nuance matters: grinding downtrends can last longer, but they also tend to produce frequent short-lived rebounds.
MACD on the daily chart shows the line and signal both around -0.01 with an almost flat histogram. This configuration adds weight to the idea that downside momentum is losing intensity. The trend remains negative, yet bears are no longer accelerating the move, which often precedes either a sideways consolidation or a relief rally back toward short-term averages.
Bollinger Bands reinforce this narrative. The middle band sits at 0.17, with the upper band near 0.19 and the lower band around 0.14, almost exactly where price is trading. Being pressed against the lower band suggests an environment of localized downside pressure with limited additional room before mean reversion attempts. ATR around 0.01 on the daily frame points to contained, but not negligible, volatility: moves of a cent on a 14-cent asset represent meaningful swings for traders, yet this is not a full-blown volatility spike.
Intraday Perspective and Dogecoin DOGE Momentum
On shorter timeframes, the picture broadly confirms the daily weakness. On the hourly chart, price is again at 0.14, with the 20, 50 and 200-period EMAs ranging roughly between 0.15 and 0.16. Meanwhile, hourly RSI is near 30, matching the daily oversold tilt and showing that intraday flows are skewed toward selling. As a result, intraday traders are not yet betting aggressively on a bounce.
MACD on both the hourly and 15-minute charts is essentially flat around zero, signaling a lack of strong intraday directional conviction. This means that while the overarching trend is down, very short-term participants are in wait-and-see mode, ready to react to breaks rather than to push price impulsively. The 15-minute RSI is slightly below 30, with price again glued to the lower Bollinger Band, which often precedes brief relief pops. However, without a reclaim of nearby EMAs around 0.15, those pops risk being sold into.
Key Levels and Market Reactions about Dogecoin (DOGE)
Daily pivot levels help refine the roadmap. The central pivot sits at 0.14, effectively where the market is trading, making this a delicate equilibrium zone for the current battle between bulls and bears. A sustained move below this region would direct attention toward first support near 0.13, where dip buyers might attempt to step in.
On the upside, the first resistance band emerges around 0.15, aligned with the initial pivot resistance and not far below the 20-day EMA near 0.17. If price manages to close above 0.15 and then challenge the area between 0.17 and 0.19, that would be the first real test of a potential trend stabilization or early bullish reversal attempt. Failure to reclaim this zone keeps the path of least resistance pointed lower.
Future Scenarios and Investment Outlook
Overall, Dogecoin DOGE faces a market dominated by fear, a heavy Bitcoin presence, and a clearly negative technical structure.
For conservative participants, the current setup argues for patience: waiting for a daily close back above the 20-day EMA and a sustained RSI recovery above 40 would provide stronger evidence of trend confirmation in a new bullish phase. Until then, rallies are more likely to encounter selling pressure near resistance bands.
More active traders might look for short-term bounces off the 0.13 6 area, using oversold readings and proximity to the lower Bollinger Band as a guide. However, they should also respect the broader bearish regime and strictly manage risk in case the asset breaks lower with renewed volatility. In any case, the coming sessions around the pivot at 0.14 and the nearby resistance at 0.15 are likely to determine whether this downtrend matures into a deeper slide or evolves into a base-building phase for the next chapter of this meme asset.
This analysis is for informational purposes only and does not constitute financial advice.
Readers should conduct their own research before making investment decisions.


추천 콘텐츠

Solana Price Sinks as Pepeto Tops $8.1M With Confirmed Binance Listing

Stablecoins dominate crypto trading volumes amid geopolitical tensions


