Ethereum News: Ethereum’s Powerful Bullish Reversal: 3 Elliott Wave Signals Defying Market Fear
Elliott Waves indicate three signs of a bullish reversal in Ethereum as the market continues to be fearful. The major Fibonacci support zone is solid.
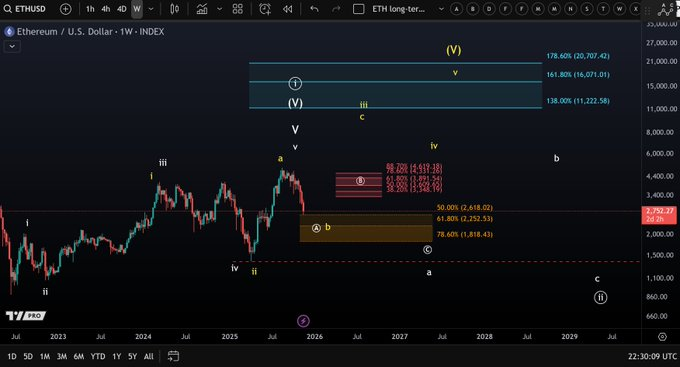
Ether has arrived at an important higher time frame support area around 1,820-2,620. This is the region that coincides with a significant Fibonacci retracement.
The support is stabilizing and molding the market expectations, according to the sources on X. Traders and investors are attracted by price action in this zone.
According to one x-post by MoreCryptoOnline, Ethereum has now achieved a significant support zone. Market correction is between 1,820 and 2,620 USD, and it is in line with Fibonacci standards. The strength of the weekly chart against recent drops increases speculation on the bullish side.
Source – X
On the daily chart, the alert is on. The yellow B wave has yet another pullback before a bigger reaction will grow, MoreCryptoOnline adds.
Such a situation implies that Ethereum may stagnate, but there are high chances of a recovery in the bigger B wave since the selling pressure will be reduced soon – assuming Ethereum does not fall below the support zone.
Three Elliott Wave Signals Spark Optimism
The price movement around the Fibonacci zone indicates three important indicators of Elliott Wave that refute negative sentiment.
Source –X
In the first place, the appearance of a corrective B wave creates a possible base for a bullish response on the Ethereum chart. This structure serves as an optimism that the upside movement may occur, and hence anticipation that eventually all-time highs will be achieved should confirmation emerge shortly.
Secondly, Elliott Wave theory indicates that the corrective phase might be over and hence a bullish impulse. According to MoreCryptoOnline, a larger B wave bouncing up or the onset of a new C wave would bring ETH to new heights. The traders keenly wait to see signs of the pullback completion.
Third, the capability of the zone to absorb the current market fear is a sign that there are still bullish participants who have not given up.
According to the analysis, the next big step of Ethereum will be established in the upcoming weeks upon support. This attitude is reflected in the community feeling, traders are tracking reactive volume and validation of wave patterns.
Present price stability contradicts the general sense of uncertainty because the large Fibonacci region holds domination.
Bullish bias is enhanced by the support of several charts. Market observers are eager to find out whether the new signals will drag Ethereum into a new momentum stage.
You might also like: ETH News: Ethereum Tests $2,700 as US Jobs Data Erodes Rate-Cut Expectations
The post Ethereum News: Ethereum’s Powerful Bullish Reversal: 3 Elliott Wave Signals Defying Market Fear appeared first on Live Bitcoin News.


추천 콘텐츠

Retail Veteran Mitch Gould’s Distribution Platform Addresses Growing Complexity in U.S. Sports Nutrition Market

Greenway steps down as flyadeal CEO after two years