

Tron crypto: is TRX nearing capitulation or a quiet rebound?
 Among large-cap altcoins, Tron crypto is navigating a tense phase that looks more like exhaustion than panic. Daily indicators show an oversold market pressed against recent lower bands, yet volatility remains surprisingly contained, opening the door to either a grinding extension of weakness or a calmer basing pattern before the next move.
 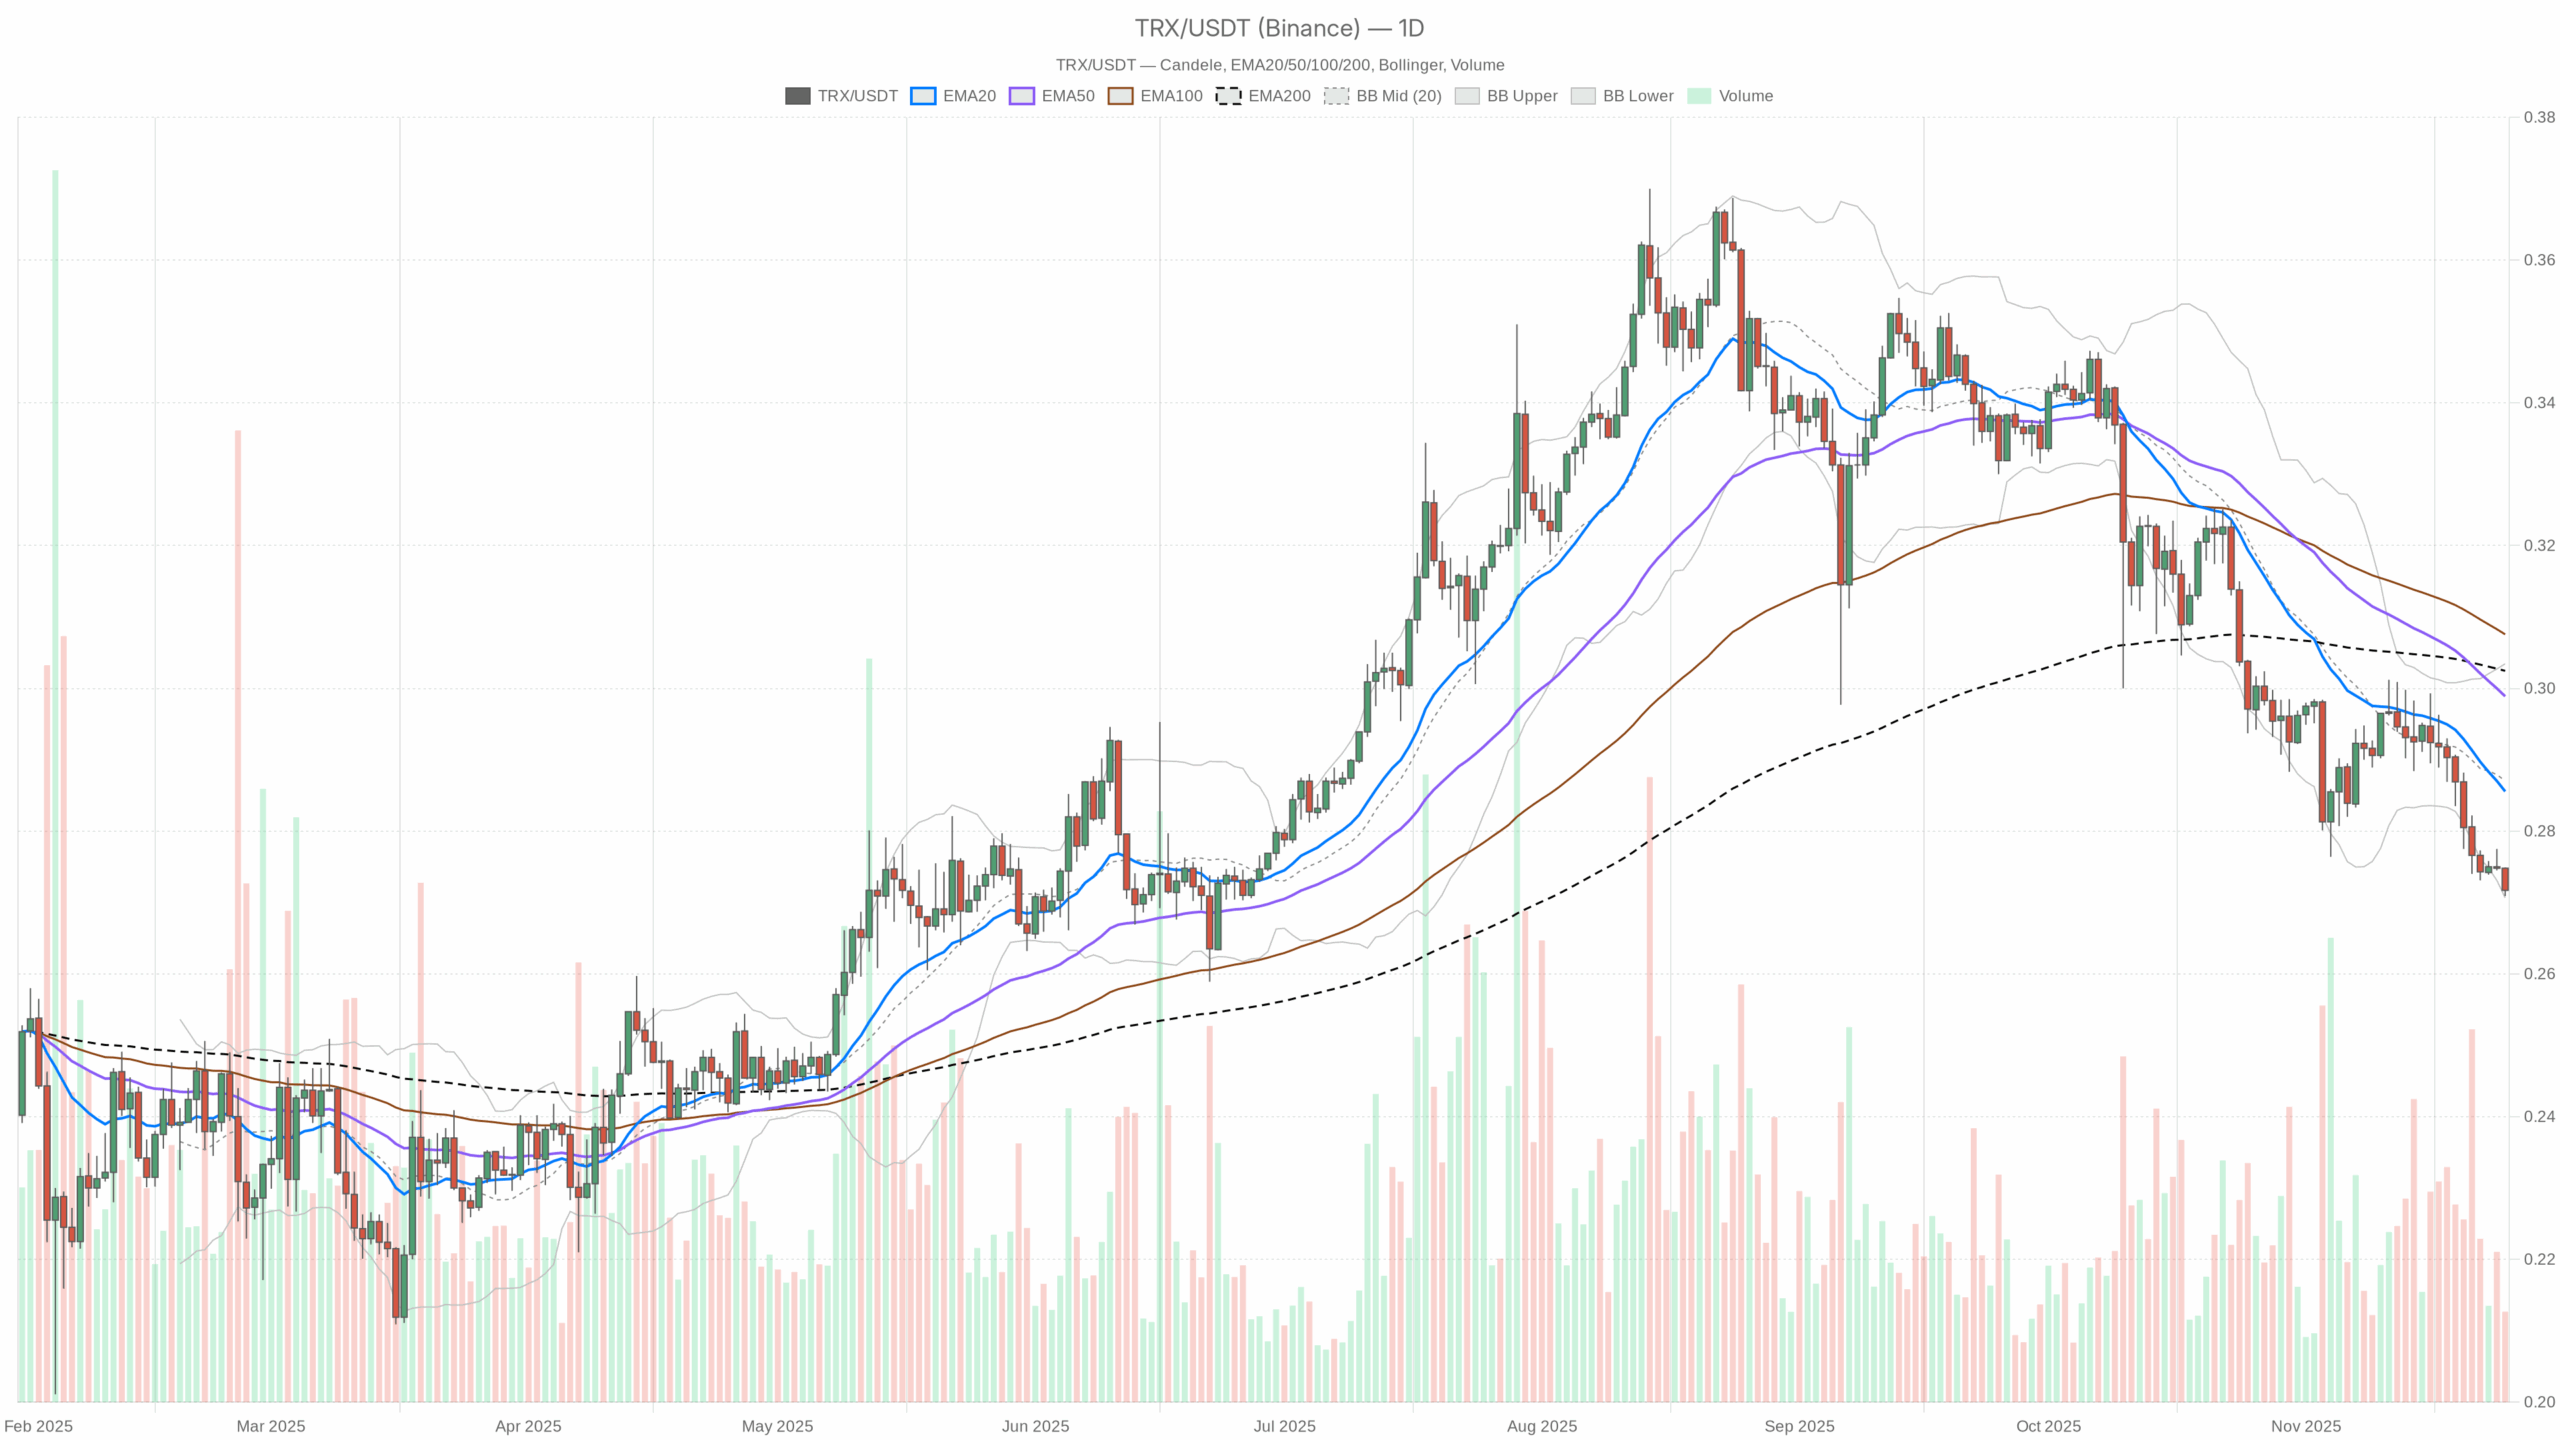 TRX/USDT — daily chart with candlesticks, EMA20/EMA50 and volume.
Summary
TRX is trading around 0.27 USDT, clearly below its key daily moving averages, which confirms a dominant bearish trend regime. The broader crypto market is still robust, with a total capitalization above 3 trillion dollars and a mild 24-hour increase, yet risk appetite is limited. Bitcoin commands about 56.5% of global market value, indicating capital concentration in the benchmark asset. Meanwhile, sentiment gauges show a Fear & Greed Index at 20, deep in “Extreme Fear” territory. Daily RSI close to 27 signals oversold conditions, but without a strong momentum reversal signal from MACD. Bollinger Bands are tight and ATR is low, so volatility remains compressed even as price tests support.
Tron crypto: Market Context and Direction
The macro context is paradoxical: the crypto market cap hovers around 3.05 trillion dollars, modestly up over the last 24 hours, yet investors behave defensively. With Bitcoin dominance above 56%, capital is clustering into the perceived safer side of the spectrum; in contrast, altcoins like TRX are left to digest prior rallies. Moreover, the Fear & Greed Index firmly in “Extreme Fear” suggests that traders are still willing to sell into strength rather than chase upside.
For this asset, that environment reinforces the existing downtrend. The daily regime is tagged as bearish, and price sitting below the 20, 50, and 200-day exponential moving averages underlines persistent downside pressure and lack of trend confirmation on the upside. That said, extreme pessimism often precedes turning points, so sentiment alone cannot be read as a one-way bearish signal.
Technical Outlook: reading the overall setup
On the daily chart, TRX trades at 0.27 USDT, below the 20-day EMA at 0.29 and the cluster of the 50- and 200-day EMAs around 0.30. This alignment, with shorter EMAs under longer ones, depicts a well-established downtrend structure where rallies are more likely to be sold. However, the distance between price and these averages is not extreme, hinting at fatigue rather than a waterfall sell-off.
The RSI at 27.12 places the token in oversold territory. Such readings frequently precede at least a pause or a countertrend bounce, as selling power shows signs of momentum exhaustion. Still, oversold conditions can persist in strong bearish phases, so the oscillator alone does not guarantee a reversal.
MACD on the daily timeframe adds nuance: both the MACD line and the signal line sit near -0.01, with a flat histogram close to zero. This points to weak downside momentum rather than aggressive selling. Bears appear in control, yet they are no longer accelerating, which often foreshadows a consolidation band where the market reassesses value.
Bollinger Bands center around 0.29, with the upper band near 0.30 and the lower band around 0.27, where price currently sits. Trading near the lower band suggests that the token is hugging support, but the relatively narrow band width signals volatility contraction instead of a disorderly breakdown. ATR at 0.01 further confirms subdued daily ranges, reinforcing the idea that this is a contained downtrend rather than a capitulation spike.
Lastly, the daily pivot point, first resistance, and first support all cluster around 0.27. This unusual overlap highlights a short-term equilibrium zone where both buyers and sellers are testing each other’s conviction. Any decisive move away from this pivot will likely define the next tactical direction.
Intraday Perspective and TRXUSDT token Momentum
While the daily picture remains negative, intraday timeframes show early signs of stabilization. On the hourly chart, the token trades at 0.27, almost aligned with the 20- and 50-hour EMAs and only slightly below the 200-hour EMA at 0.28. This flattening of moving averages reflects short-term consolidation inside a broader bearish context.
Meanwhile, hourly RSI hovers near 31, still weak but no longer deeply oversold. MACD on both the hourly and 15-minute charts is flat at zero, hinting that intraday momentum has cooled. As a result, short-term traders are facing a range-bound market where quick swings are limited, and directional conviction is low.
On the 15-minute timeframe, the RSI around 43 underlines an almost neutral stance, consistent with a micro-range at 0.27. The intraday regimes are still classified as bearish, yet the lack of fresh lows and the compressed volatility profile point toward a potential base-building phase rather than an immediate continuation of the slide.
Key Levels and Market Reactions
The most immediate battleground lies around 0.27 USDT, where daily and intraday pivots converge. Sustained trading below this area would confirm that sellers retain control and could drag the token toward new local lows, even if the path remains slow and choppy. Conversely, a rebound that reclaims 0.29 first, and then the 0.30 region where the 50- and 200-day EMAs sit, would challenge the current structure.
Should price manage a daily close back above the mid-Bollinger band near 0.29, it would signal early bullish validation within an otherwise bearish market. Until then, every test of 0.29–0.30 is likely to attract supply from trapped longs and opportunistic shorts. Traders will watch how volume and volatility react around these zones to judge whether the move is just a relief rally or something more durable.
Future Scenarios and Investment Outlook
Overall, the balance of evidence favors a cautious stance: the trend is down, sentiment is fearful, and the asset sits beneath its major averages. Yet oversold oscillators, flat MACD, and tight bands collectively argue for consolidation with bounce risk rather than an imminent collapse. For directional traders, the more attractive setups may emerge on a clear break above the 0.29–0.30 resistance band or, alternatively, on a decisive failure of 0.27 with expanding ATR.
Longer-term participants might interpret the current weakness as part of a normal cycle in a market still dominated by Bitcoin, especially while decentralized activity on Tron-based DEXs like SUNSwap continues to generate substantial cumulative fees. However, with extreme fear still prevalent, risk management remains paramount: scaling entries, avoiding leverage under compressed volatility, and respecting invalidation levels are essential to navigating the next chapter for this network’s native asset.
This analysis is for informational purposes only and does not constitute financial advice.
Readers should conduct their own research before making investment decisions.


추천 콘텐츠

The Role of Reference Points in Achieving Equilibrium Efficiency in Fair and Socially Just Economies

United States MBA Mortgage Applications up to -0.8% in April 3 from previous -10.4%


