

Solana crypto news: SOL under pressure but volatility hints at a turning point

In the latest Solana crypto news landscape, SOL’s pairing against USDT is navigating a fragile phase where sentiment, liquidity and trend structure are clearly under strain. Yet, the same stress that is pushing prices lower could also be preparing the ground for the next decisive move, as traders reassess risk under a heavy macro and on-chain backdrop.
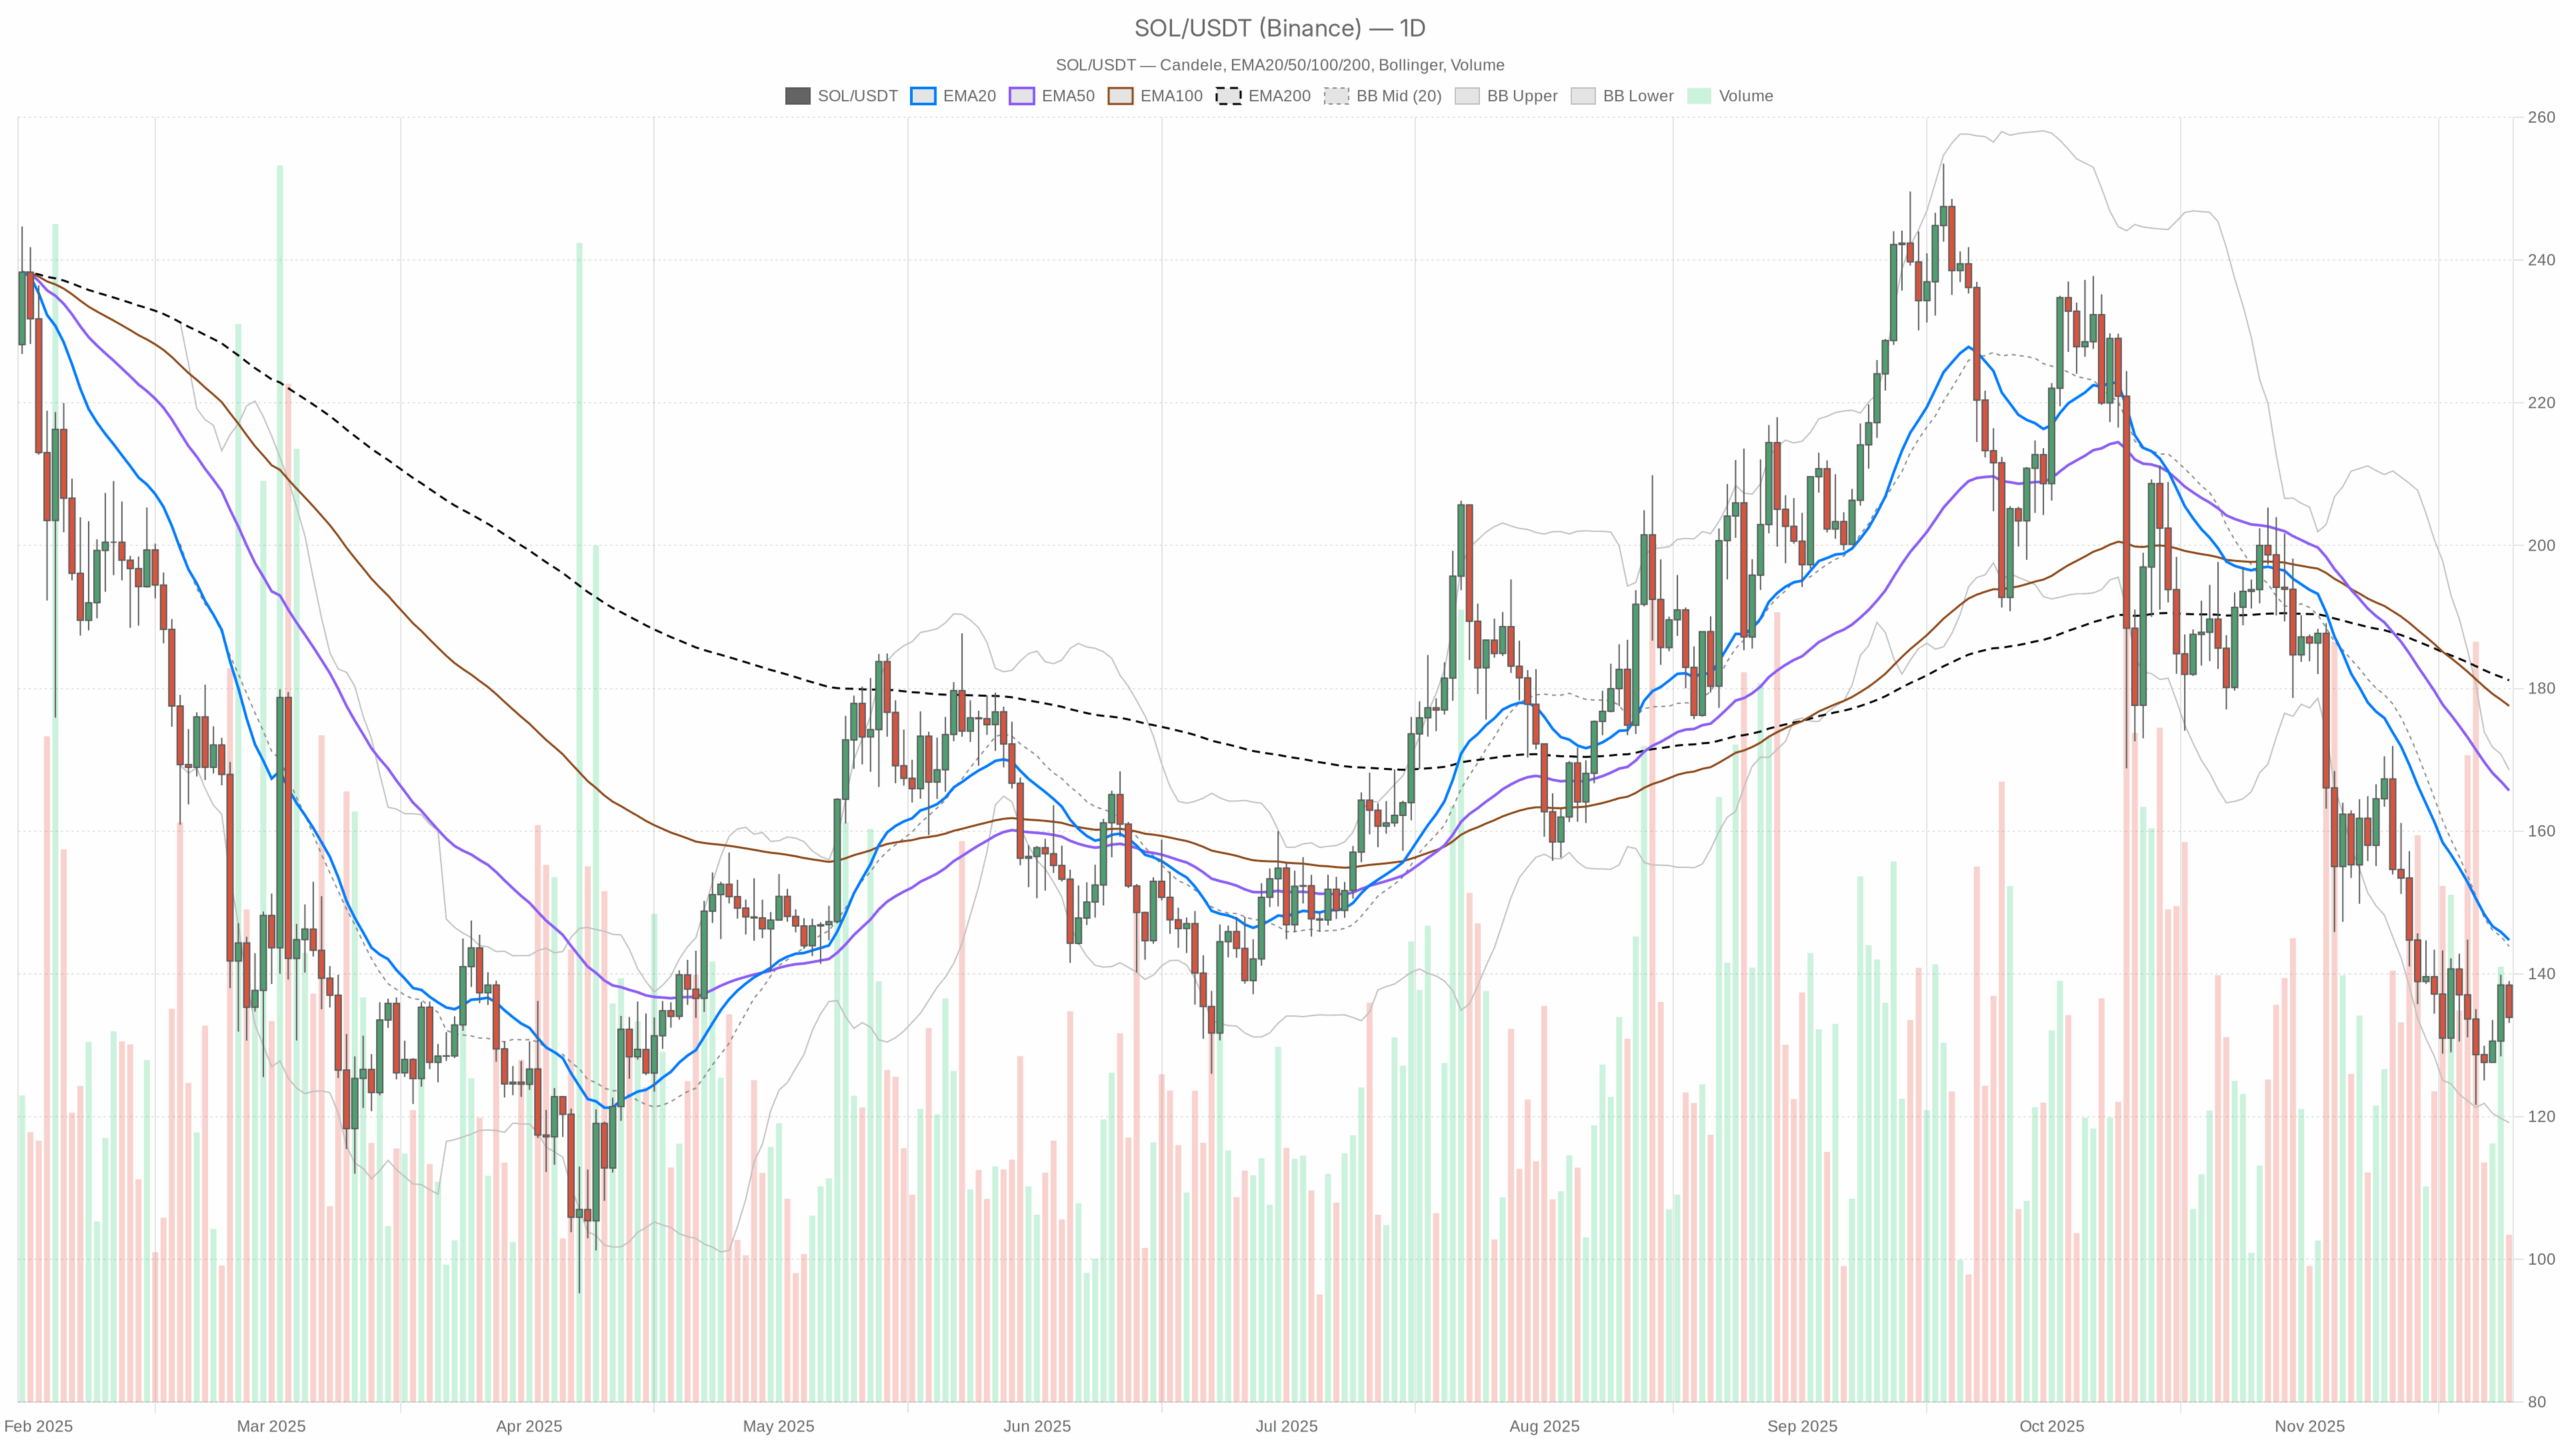 SOL/USDT — daily chart with candlesticks, EMA20/EMA50 and volume.
Summary
The daily chart shows SOL trading near 133.9 USDT, firmly below its medium- and long-term moving averages, confirming a broadly bearish market regime. Momentum indicators lean negative but not capitulative, pointing more to grinding downside and consolidation than to a full flush. Moreover, volatility on the daily time frame is moderate, with the Average True Range near 10.44 USDT, leaving room for meaningful swings around current prices. Intraday, the picture is slightly less heavy, with hourly and 15-minute regimes classified as neutral rather than outright bearish. However, Bitcoin dominance above 56% and a crypto Fear & Greed Index stuck in Extreme Fear suggest that capital is cautious and prefers majors over higher-beta tokens. Overall, short-term traders are probing for a tactical bounce, while longer-term participants still face a damaged but potentially stabilizing trend.
Solana crypto news: Market Context and Direction
The broader market backdrop is still relatively constructive in aggregate, with total crypto capitalization around 3.05 trillion dollars and a mild 24-hour increase. However, that positive surface hides a sharp preference for safety: Bitcoin commands more than 56% market share, which historically leaves less room for aggressive altcoin rotations. In contrast, SOL represents only a small slice of the global pie, underlining the current hierarchy where liquidity favors the largest names.
The sentiment side of the equation is even more telling. The Fear & Greed Index sits at 20, firmly in Extreme Fear territory, reinforcing that investors remain highly defensive. This backdrop tends to suppress trend strength on the upside for altcoins, while also increasing the probability of sharp but short-lived relief rallies. Moreover, DeFi activity on Solana’s ecosystem, as seen through Raydium, Orca and other DEX fees, shows mixed signals: long-term fee accumulation remains large, but recent percentage drops in monthly averages point to a cooling speculative cycle. That said, the ongoing acquisition narrative around Solana infrastructure, such as Coinbase’s move for a native trading platform, reminds markets that structural interest in the ecosystem persists beyond day-to-day price noise.
Technical Outlook: reading the overall setup
On the daily chart, SOL trades at 133.9 USDT, clearly beneath the 20-day exponential moving average at 144.74, the 50-day at 165.68, and the 200-day at 181.13. This stacked configuration of EMAs, all well above spot, confirms a mature downtrend with no immediate trend reversal. Each of these moving averages now acts as dynamic overhead pressure, suggesting that any bounce toward them could meet selling interest from trapped longs or systematic strategies.
The Relative Strength Index at 37.72 supports that picture. It sits below the neutral 50 mark but still above classical oversold territory, signaling bearish momentum without full exhaustion. In practice, this means sellers are in control, yet there is still room for additional downside before a strong mean-reversion impulse becomes statistically more likely.
The MACD on the daily frame tells a slightly more nuanced story. The line at -12.31 remains below zero, confirming negative momentum, but it has edged just above its signal at -13.25, with a modestly positive histogram of 0.95. This subtle crossover hints at a potential momentum deceleration within the broader downtrend, often a precursor to sideways consolidation or a counter-trend rally rather than an immediate sustained reversal.
Bollinger Bands add further context: the midline sits at 143.85, with the upper band at 168.55 and the lower at 119.15. Price near 133.9 is hovering in the lower half of this volatility envelope, which aligns with downside bias but not an extreme volatility expansion. The asset is not hugging the lower band aggressively, suggesting pressure is present but not yet in a panic phase.
Finally, the Average True Range at 10.44 points to moderate daily volatility. For traders, this means that intraday moves of several dollars are entirely plausible, but the market is not in a blow-off or capitulation regime. As a result, risk management must still respect potential sharp counter-moves against the prevailing trend.
Intraday Perspective and SOLUSDT token Momentum
Meanwhile, the intraday structure is softer than the daily downtrend might imply. On the hourly chart, SOL trades around 133.97 USDT, very close to its pivot at 134.08, with a regime labeled neutral. The 20-period EMA at 135.92 lies slightly above current price, while the 50 and 200 EMAs cluster between 134.44 and 135.03, forming a tight range. This clustering hints at an ongoing consolidation phase, where neither bulls nor bears hold decisive intraday control.
The hourly RSI around 40.68 is subdued yet not extreme, signalling mild downside pressure. However, the MACD line at 0.23 has slipped below its signal at 0.84, with a negative histogram of -0.61, implying that recent attempts to rebound are fading. As a result, intraday traders may see choppy action with a slight bearish tilt, especially as price oscillates around the hourly pivot.
On the 15-minute chart, the picture becomes more tactical. Price at 133.97 is below the 20- and 50-period EMAs (135.62 and 136.25) but near the 200 EMA at 134.21. The short-term RSI at 30.9 is close to oversold, indicating momentum strain on very short horizons. The MACD line at -0.61 remains under its signal at -0.4 with a negative histogram, confirming that microstructure still favors sellers, yet the proximity to oversold territory raises the probability of quick, technical bounces.
Key Levels and Market Reactions
Daily pivot analysis places the central reference point near 135.34 USDT, just above spot. Holding below this area keeps the short-term bias negative. Immediate resistance emerges in the zone around 137.5 USDT, which coincides with the first pivot resistance on both daily and intraday frames. A push into that band, if rejected, would likely confirm ongoing distribution on rallies and could send price back toward the lower Bollinger region.
On the downside, support appears first in the 131.7 USDT area, in line with the daily first support level, and then closer to the lower daily Bollinger Band around 119.1. A clean break below 131.7, followed by acceptance toward 120, would reinforce the current bearish continuation setup. Conversely, a reclaim of 137–145, particularly if daily closes start to form back above the 20-day EMA at 144.74, would be an early signal that sellers are losing control.
Future Scenarios and Investment Outlook
Overall, the charts describe a market in which the dominant trend still points lower, but with early hints of stabilization in momentum. Swing traders may prefer to wait for confirmation, either through a decisive breakdown below key supports that validates another leg down, or through a series of higher lows supported by RSI recovery above 50. Meanwhile, intraday participants can exploit the current range-bound behavior, but only with tight risk parameters given the backdrop of Extreme Fear.
Longer-term investors may view the present structure as a developing base rather than a confirmed bottom, as EMAs remain stacked bearishly and volatility can still expand. A patient strategy, scaling in only if price begins to reclaim major moving averages and if market-wide risk appetite improves from today’s depressed levels, appears more prudent than aggressive dip-buying. In this sense, the latest Solana crypto news headlines matter less than whether price can transform the current pressure into a durable shift in market regime.
This analysis is for informational purposes only and does not constitute financial advice.
Readers should conduct their own research before making investment decisions.


추천 콘텐츠

The Role of Reference Points in Achieving Equilibrium Efficiency in Fair and Socially Just Economies
CoinRabbit Reduces Crypto Lending Rates for XRP Loans and 300+ Assets


