

How High Can XRP Still Go This Cycle? Chartist Says $8 Possible
XRP traders are once again arguing about upside targets after popular chartist Charting Guy reposted a bullish long-term setup and doubled down on his call that XRP can still reach $8 this cycle. “XRP still going to $8, idc,” he wrote on X in the early hours of Nov. 25, alongside a weekly XRP/USD chart from Bitstamp.
XRP Price Still Has Room To Run
At the time of the screenshot, XRP was trading around $2.25, up roughly 9.8% on the week, with the chart plotting an Elliott Wave structure from early 2023 into a projected peak in 2026. The analysis is built on a dense Fibonacci framework spanning from about $0.25 to a 1.272 extension at $8.29661, which anchors his upside target.
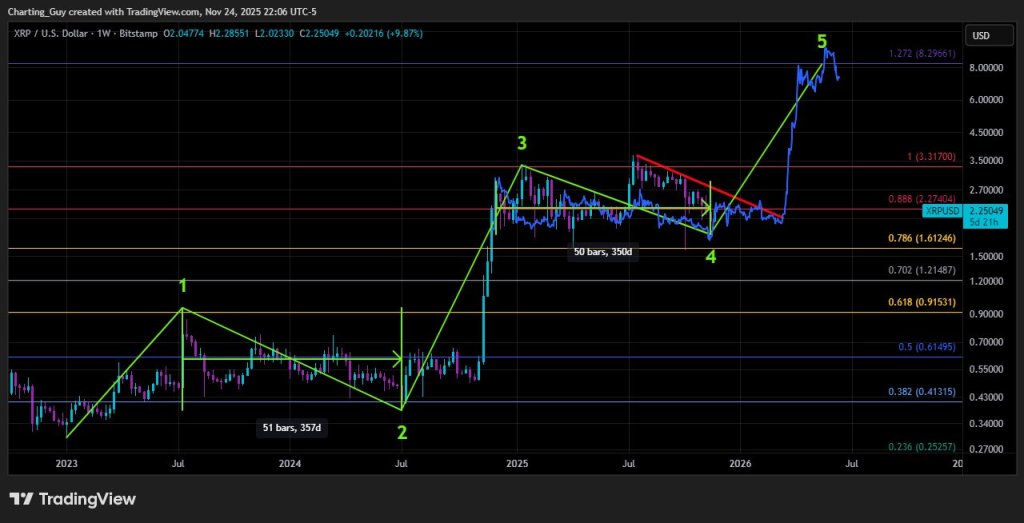
The green wave count shows a classic five-wave impulse. Wave 1 launches from the post-bear-market base into the 0.618 Fibonacci level near $0.915, where the first leg tops out. Wave 2 then retraces for 51 weekly bars (357 days), bottoming just above the 0.382 retracement at $0.41315.
Wave 3 is drawn as a steep rally off that base, blasting through all mid-range Fibonacci bands and extending beyond the 1.0 level at $3.31700. In the replies, one user suggested the spike to around $3.65 had already completed the fifth wave; Charting Guy rejected that outright: “it wasn’t… was very clearly a B wave.”
From that high, the chart records a year-long consolidation labelled as Wave 4, annotated as 50 weekly bars (350 days). Price fluctuates between roughly the mid-$2 area and above $3. The Wave-4 low holds above the 0.786 Fibonacci support at $1.61246, never revisiting the $1 region.
From this consolidation, the projected Wave 5 shoots higher from around the $2–$2.30 zone—where XRP is currently trading—toward the 1.272 extension at $8.29661. The “5” marker sits at this level, and the projection shows only a modest pullback after touching the band, implying that this area is treated as the probable cycle cap.
The Fibonacci grid also frames the current battle zone. XRP’s price is oscillating around the 0.888 level at $2.27404, which lines up almost exactly with the latest weekly close, while the prior wave-3 region around $3.317 remains the next major resistance band on the chart.
Not everyone is convinced. “Could still go under 1.50. Still,” wrote another user. Charting Guy’s response was curt: “no.” That stance matches the technical layout: in his count, the $1.61 area has already printed the Wave-4 low, and the structure does not include another trip below that support.
Others pushed for higher numbers. “Was hoping for $20+,” one follower admitted. “could happen,” the analyst replied—before clarifying to another user that “$20 is not on track but still entirely possible.” His published chart, however, draws no path beyond the $8.29 extension, underlining that mid-single-digit territory remains his primary target for this cycle.
At press time, XRP traded at $2.20.


추천 콘텐츠

The Role of Reference Points in Achieving Equilibrium Efficiency in Fair and Socially Just Economies
CoinRabbit Reduces Crypto Lending Rates for XRP Loans and 300+ Assets


