XRP Must Hold This Area Otherwise a Crash Below $1.6 Becomes Likely: Ripple Price Analysis
Ripple continues to trade within a broader corrective structure, with price showing limited bullish momentum and remaining below key resistance levels.
While short-term reactions have appeared near support, the overall structure suggests the altcoin is still in a consolidation-to-distribution phase rather than a confirmed trend reversal.
XRP Price Analysis: Technicals
By Shayan
The Daily Chart
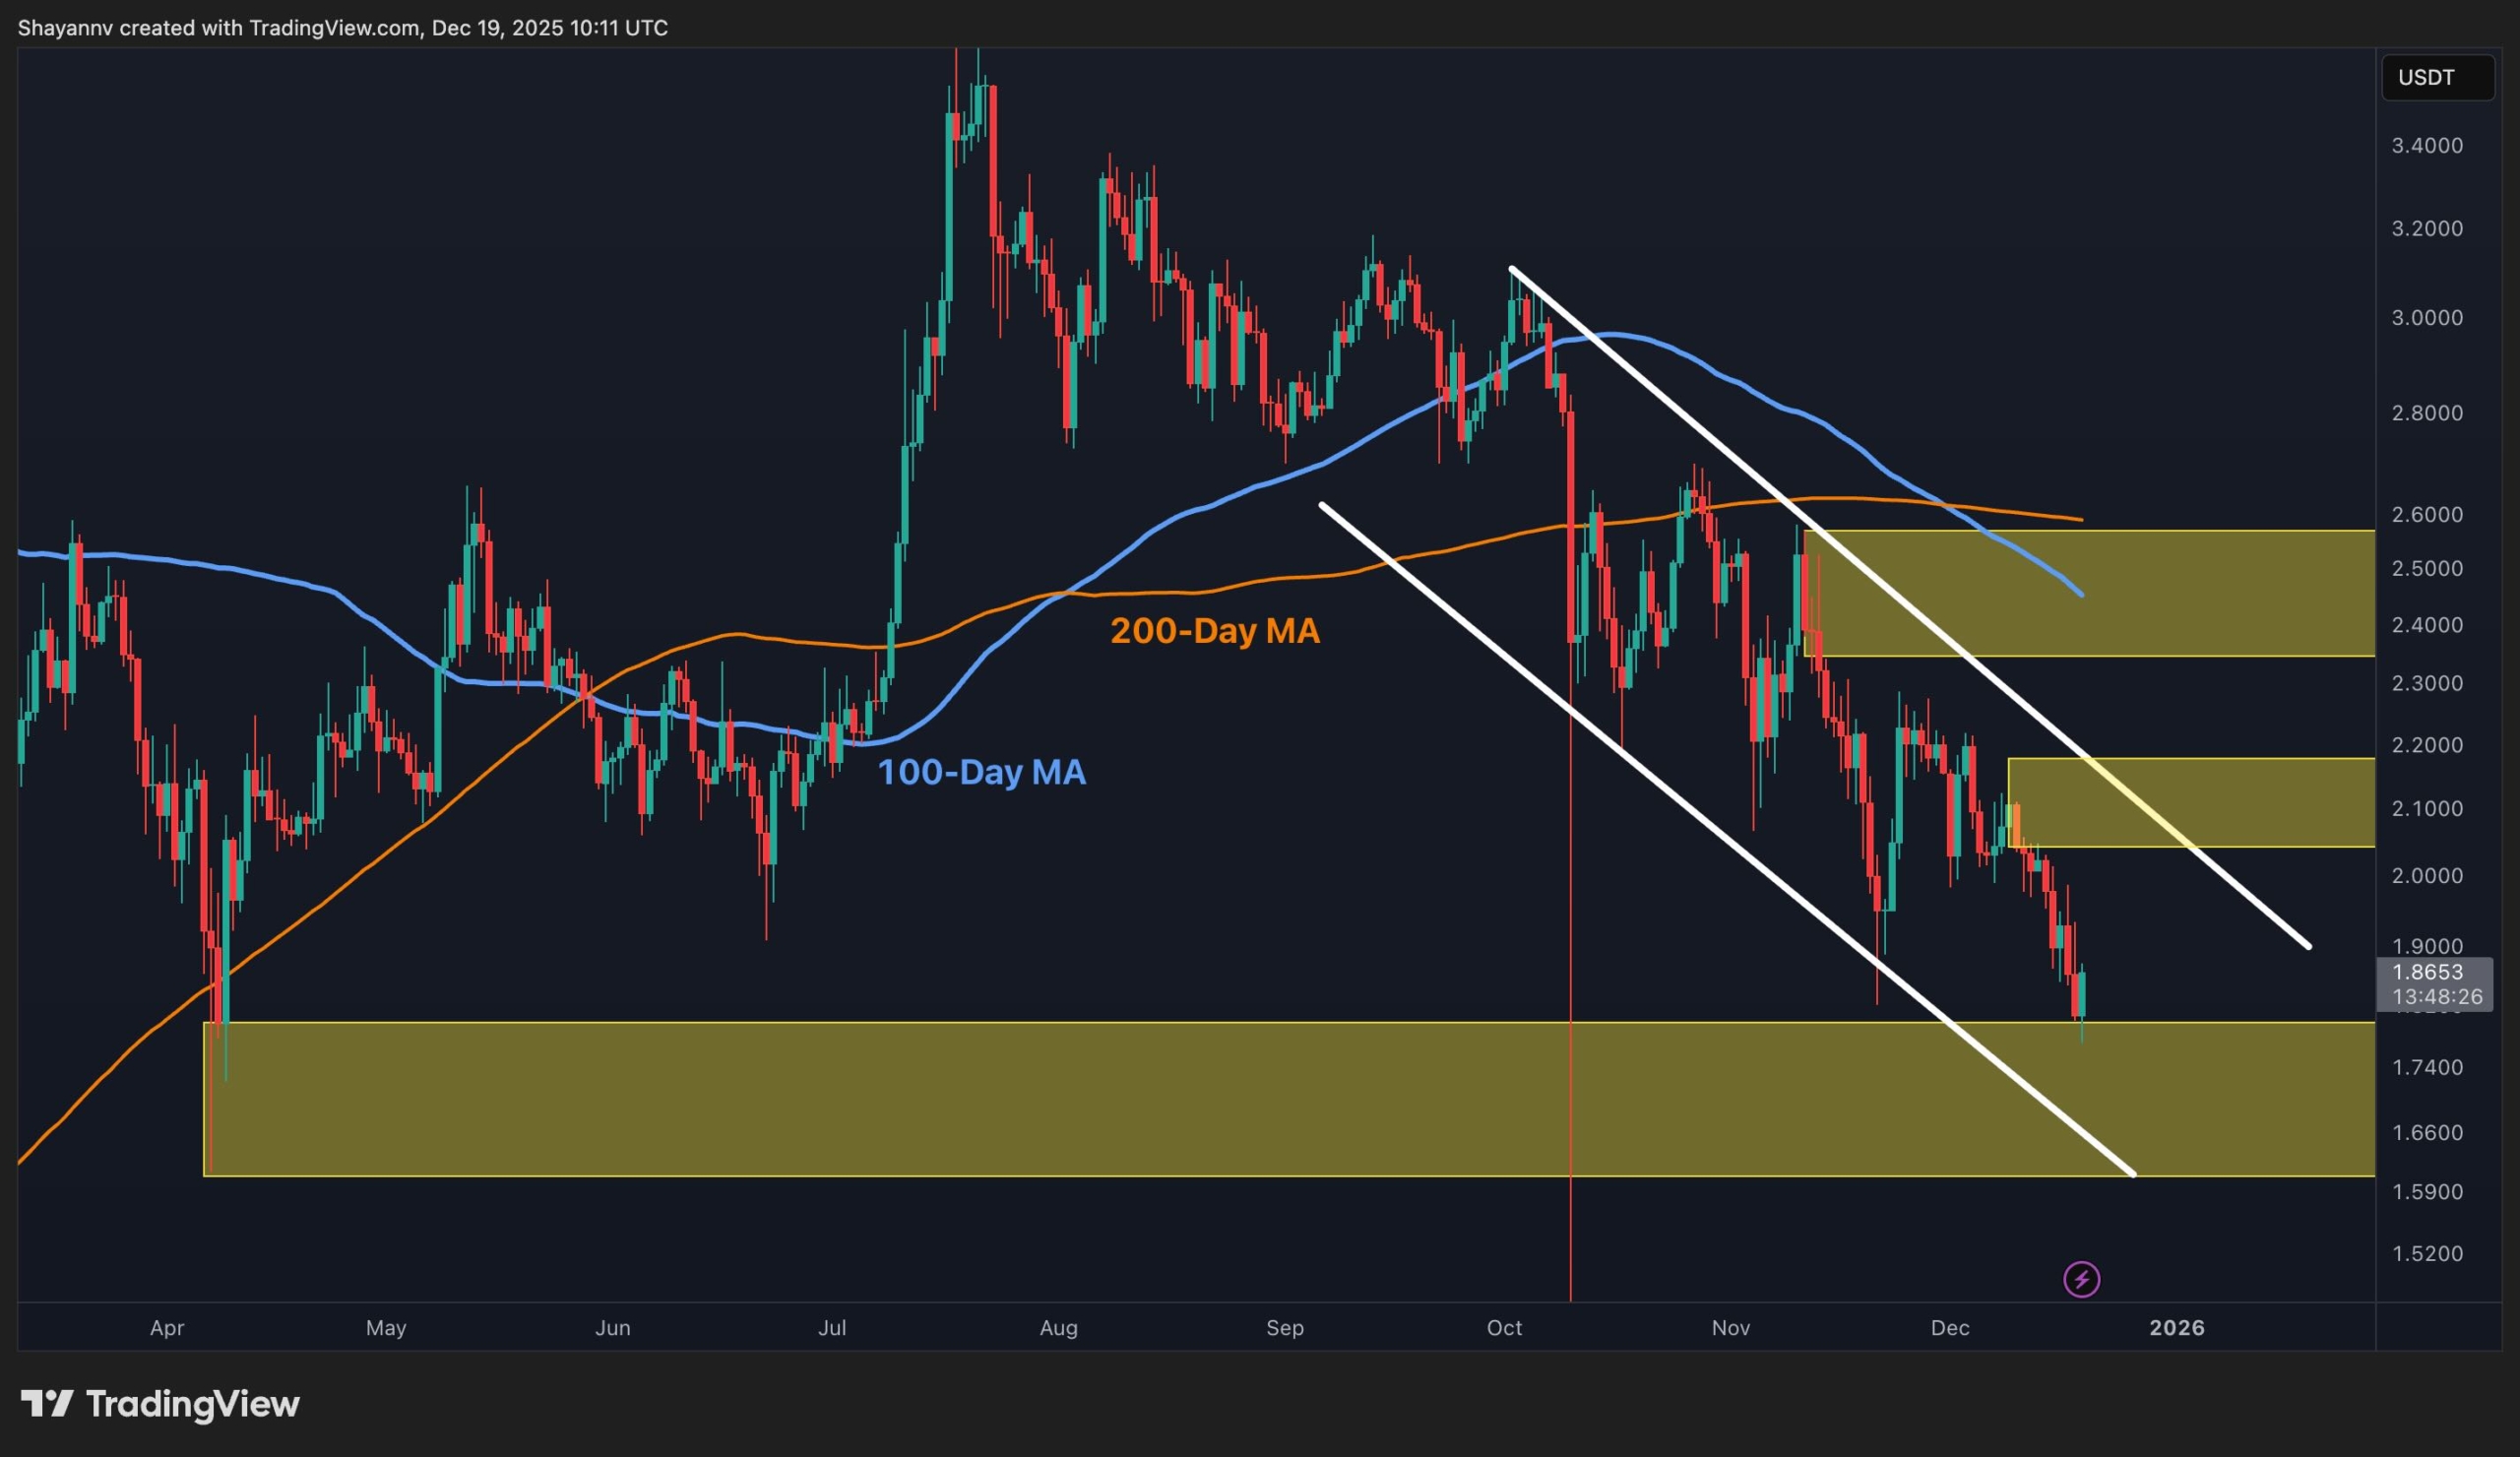
On the daily timeframe, XRP remains firmly below the descending trendline that has capped price action since the major breakdown from higher levels. This trendline continues to act as a dominant dynamic resistance, and each approach toward it has resulted in renewed selling pressure.
The price is also trading below both the 100-day and 200-day moving averages, reinforcing the bearish-to-neutral bias. The primary overhead supply zone is located around the $2.4 to $2.5 region, where previous breakdowns and failed reclaim attempts occurred. As long as XRP remains below this area, upside moves are likely to remain corrective.
On the downside, XRP is currently trading just above a major demand zone around the $1.7 to $1.8 range. This zone has historically attracted buyers and represents the most important structural support on the daily chart. A sustained daily close below this region would significantly weaken the market structure and expose deeper downside risk.
 Source: TradingView
The 4-Hour Chart
On the 4-hour timeframe, XRP has broken below a local descending wedge, reflecting persistent lower highs and lower lows. The recent bounce from the lower boundary of the broader channel appears reactive rather than impulsive, indicating a lack of strong buyer commitment.
Short-term resistance sits around the $2 to $2.1 area, where price previously consolidated before breaking lower. This zone has now flipped into supply and aligns with the upper boundary of the descending channel. Until Ripple reclaims this level with strong momentum, upside attempts are likely to face rejection.
If price fails to hold above the current support and loses acceptance below the $1.8 region, the probability of a deeper liquidity sweep increases. Such a move would likely target the lower end of the broader demand zone and potentially extend the corrective phase before any meaningful recovery can develop.
Overall, Ripple remains structurally weak across both timeframes, with trend resistance overhead and critical support directly below the current price. A clear shift in structure and a reclaim of key resistance levels are required before a sustained bullish scenario becomes viable.
 Source: TradingView
The post XRP Must Hold This Area Otherwise a Crash Below $1.6 Becomes Likely: Ripple Price Analysis appeared first on CryptoPotato.


추천 콘텐츠
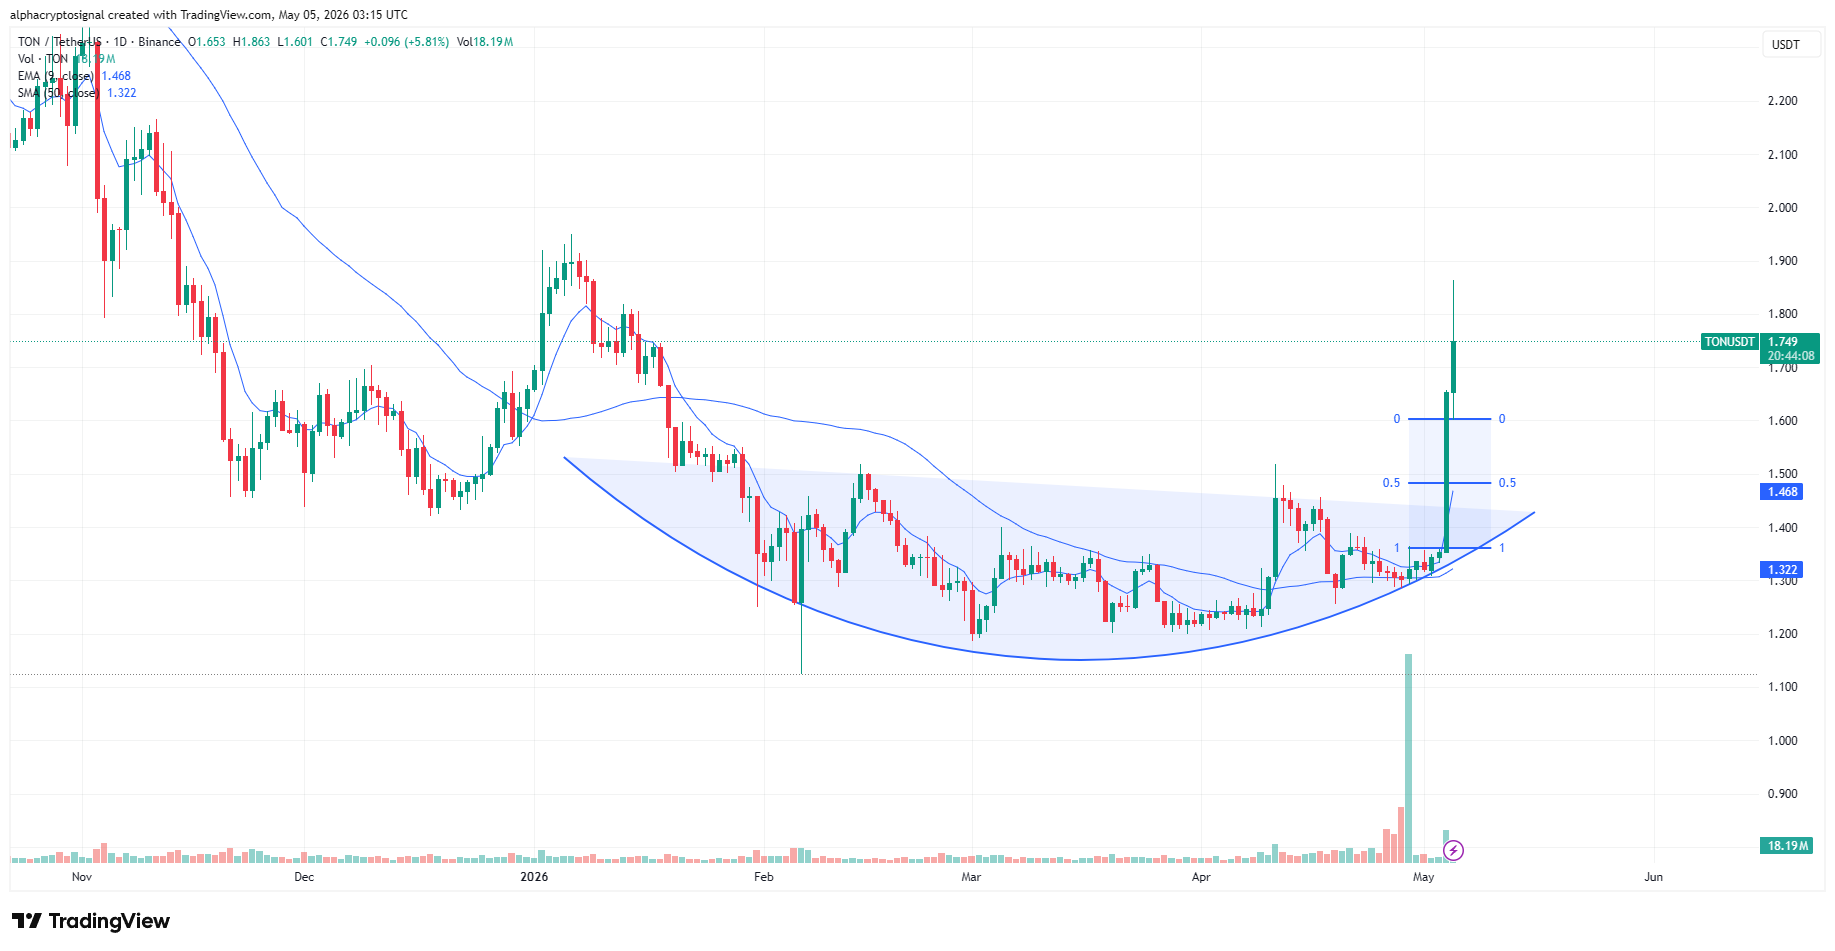
What’s Behind the 25% Toncoin (TON) Price Rally Today?

BTC Price Shaky Near $67K While Oil Surges on Middle East Tensions: What's Next? (April 2 Update)