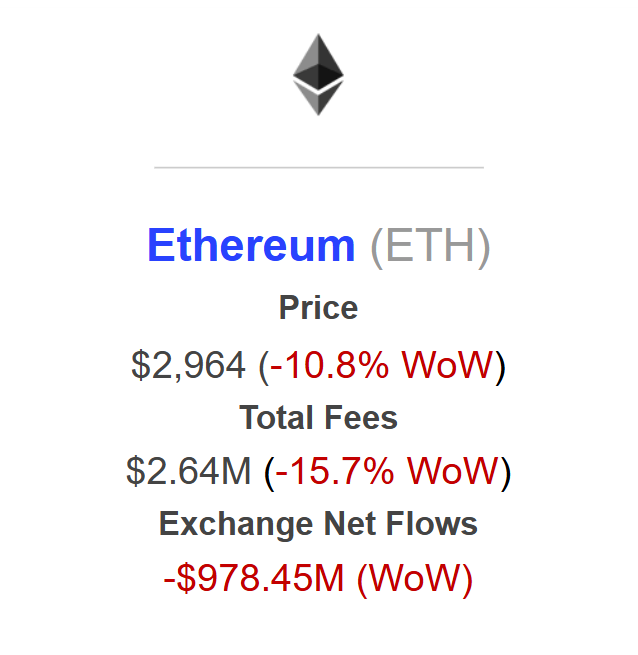
Ethereum Exchange Outflows Soar To $978M: Sign Of Dip Buying?
On-chain data shows the Ethereum exchange netflow has witnessed a negative spike during the past week, a potential sign that investors have been accumulating.
Ethereum Exchange Netflow Has Been Red For The Past Week
As pointed out by institutional DeFi solutions provider Sentora in a new post on X, Ethereum has seen net outflows from exchanges in the past week. The indicator of relevance here is the “Exchange Netflow,” which measures the net amount of ETH that’s moving into or out of wallets connected with centralized exchanges.
When the value of this metric is positive, it means the investors are depositing a net number of tokens to these platforms. As one of the main reasons why holders deposit their coins to exchanges is for selling-related purposes, this kind of trend can be bearish for the asset’s price.
On the other hand, the indicator being below zero suggests outflows are dominating the inflows on exchanges. Such a trend can be a sign that investors are in a phase of accumulation, which can naturally be bullish for the cryptocurrency.
As the data shared by Sentora shows, Ethereum has seen a weekly Exchange Netflow value of -$978.45 million, indicating that traders have made a massive amount of net withdrawals.
The significant outflows have come as Ethereum has witnessed a decline during the past week. As Sentora explains:
The price drawdown in the past week has also accompanied a drop in the total transaction fees on the network, meaning that transfer activity has gone down. The blockchain saw about $2.64 million in fees over the last week, which is more than 15% down week-over-week.
ETH Saw A Brief Visit Under $2,800 Before Rebounding
Ethereum observed a decline to $2,780 on Thursday, but the asset was able to bounce back as it’s now floating just under $3,000.
Interestingly, ETH’s bottom was around the same level as a major on-chain supply cluster, as a chart shared by analyst Ali Martinez in an X post shows.
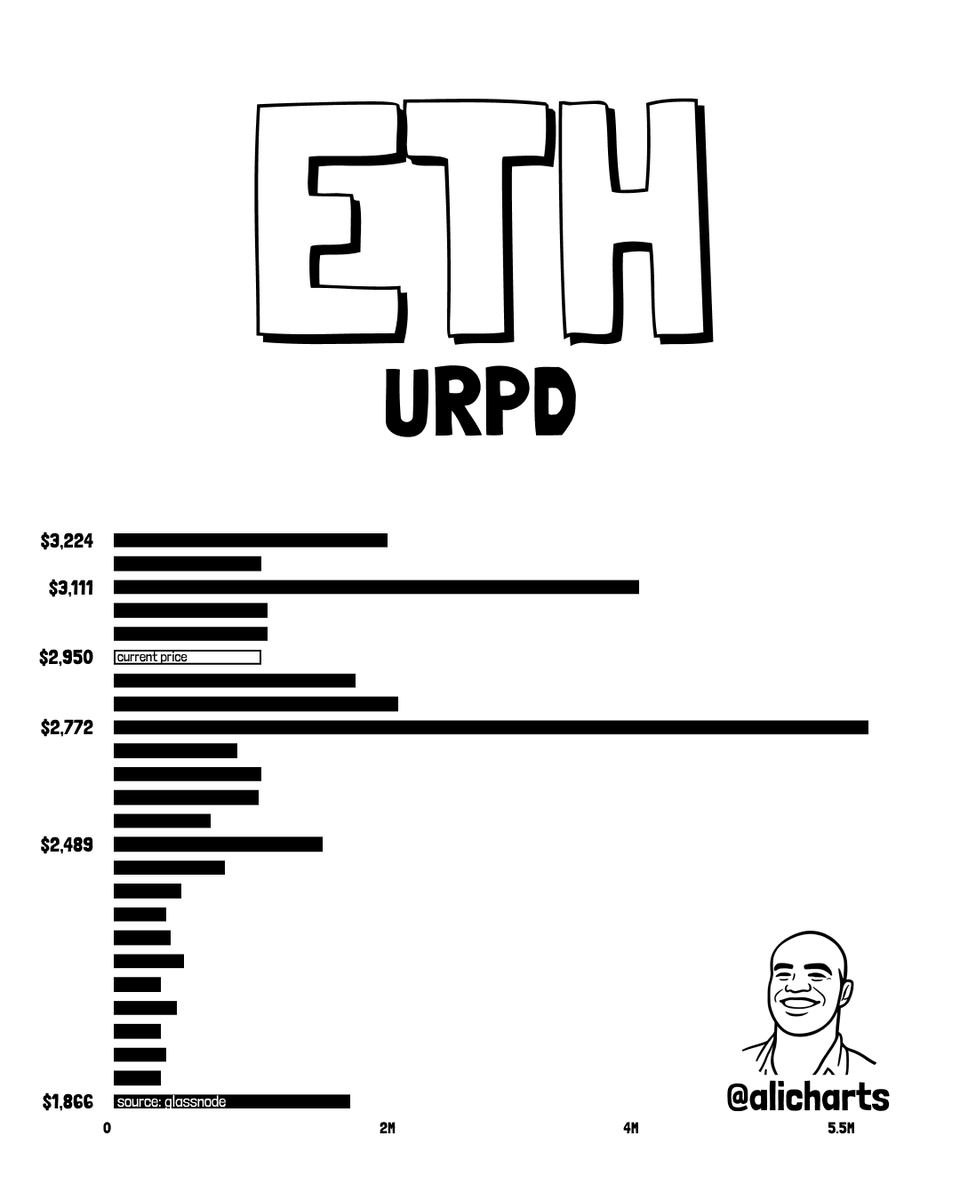
In the graph, Martinez has attached the data of the Ethereum UTXO Realized Price Distribution (URPD) from on-chain analytics firm Glassnode. This metric basically tells us how much ETH supply was last transacted at the various price levels that the coin has visited in its history.
There is a huge supply zone located at $2,772 on the URPD, suggesting a large amount of investors have their cost basis at it. Generally, such levels act as a support boundary during downtrends, as traders who purchased there buy the dip to defend it.


추천 콘텐츠

Next Big Crypto to Hit $1? Mutuum Finance (MUTM) Prediction 2027-2028

Ethereum Sheds $81.6 Million in Funds as Crypto Snaps Mid-Week Risk Off