Bitcoin Price Reclaims $90,000 — Why Some Analysts Still See Downside Risk

The post Bitcoin Price Reclaims $90,000 — Why Some Analysts Still See Downside Risk appeared first on Coinpedia Fintech News
After the rebound from the local lows below $85,000, the Bitcoin bulls have been gaining significant strength. The price has now surged above $90,000, following a consolidated weekend, hinting towards a sustained ascending trend for the rest of the week. The volume has been raised gradually since the early trading hours, pushing the BTC price higher from the local lows close to $87,600. The recent reversal could seem like a healthy reversal, but in the long run, it could be yet another short-term bounce, resulting in a deeper correction.
Bitcoin (BTC) has pushed back above $90,000, reclaiming a psychologically important level after a sharp sell-off earlier this month. Price is up nearly 2% on the day, but the broader structure still reflects caution rather than confirmation. Despite the rebound, Bitcoin remains well below its recent highs and is trading inside a compressed range. For traders, the key focus is whether this move signals renewed strength—or just another pause before volatility returns.
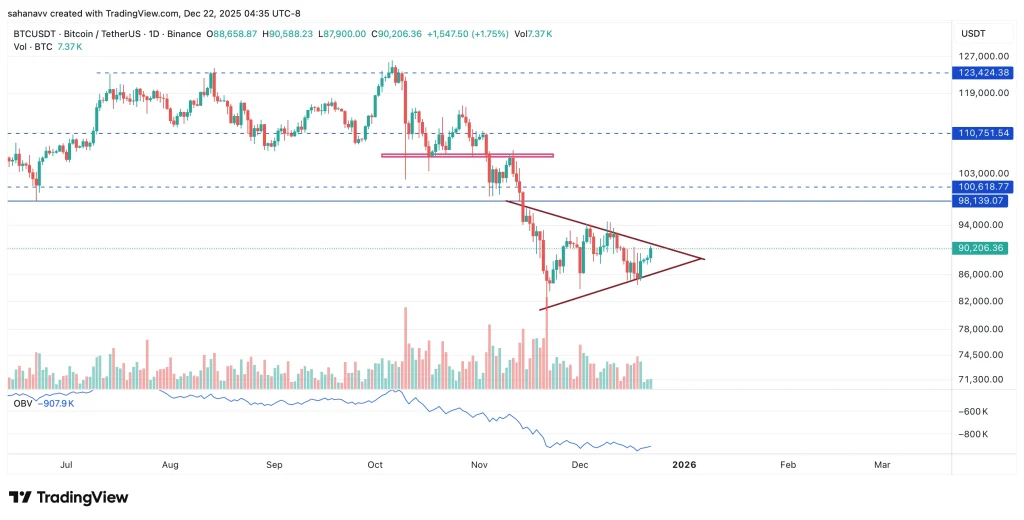
On the daily chart, Bitcoin is consolidating inside a symmetrical triangle, formed after the breakdown from the $100K–$103K support zone. This pattern reflects indecision following heavy distribution, with lower highs capped beneath descending resistance. OBV remains weak, suggesting accumulation has not yet resumed convincingly. A breakout above $92K–$94K could open the door toward $98K, while failure to hold current levels risks another move toward the $85K–$82K demand zone. Direction hinges on the next expansion in volume.
- Also Read :
- Why Japan’s Rising Bond Yields Are Making Bitcoin Traders Nervous
- ,
Is Bitcoin Price Heading Below $40,000?
A widely shared quarterly chart of Bitcoin by analyst Ali is drawing attention for what it suggests about long-term market structure rather than short-term price direction. By zooming out to multi-year candles, the chart highlights how Bitcoin’s biggest rallies have historically been followed by deep, extended corrections. With BTC recently trading above $90,000, the chart has reignited debate around whether sharp pullbacks are still part of Bitcoin’s natural cycle—even at much higher price levels.
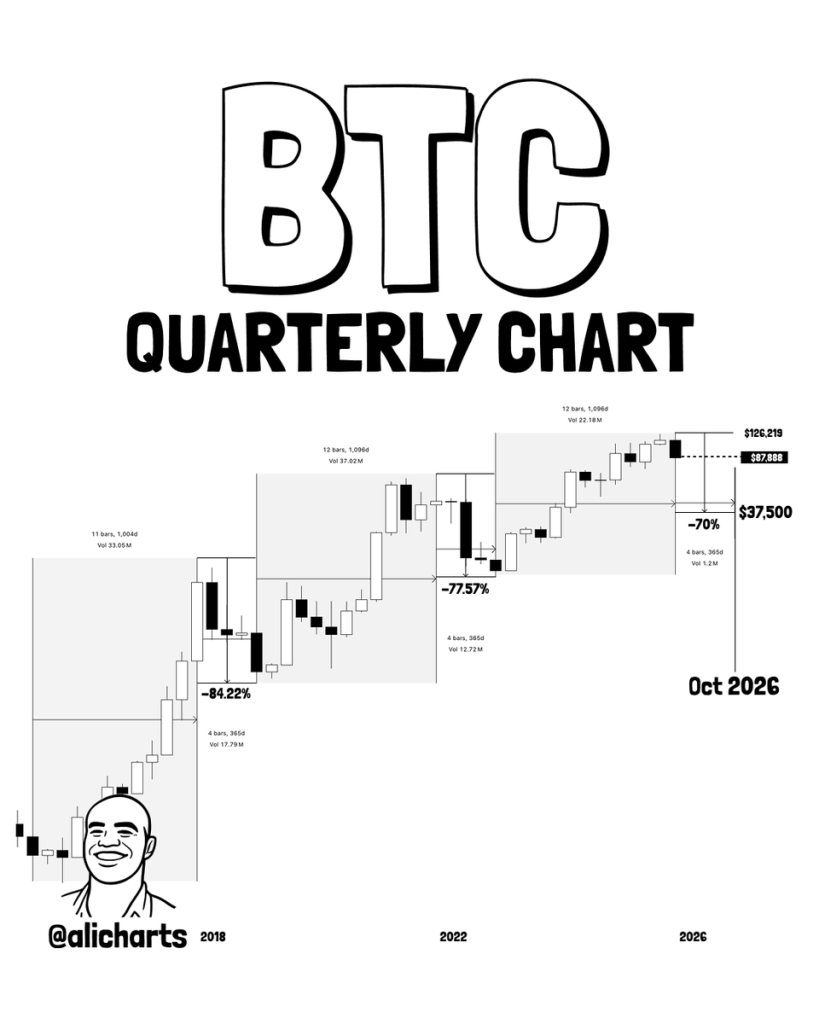
The quarterly chart illustrates a recurring pattern: after each major bull cycle, Bitcoin has experienced drawdowns of roughly 70–85% before establishing a higher long-term base. Previous cycles saw declines near –84% (2018) and –77% (2022), while the projected scenario highlights a potential –70% correction from a future peak, pointing toward the $35,000–$40,000 zone. Importantly, this is not a timing forecast. It’s a macro framework showing that deep corrections have historically coexisted with Bitcoin’s long-term upward trend.
What’s Next for the BTC Price Rally?
In the short term, the daily chart shows Bitcoin (BTC) price compressing inside a triangle just above $90,000, signalling indecision and the likelihood of a volatility expansion rather than a clean trend continuation. In the long term, the quarterly chart reminds traders that even powerful bull cycles have historically included deep corrective phases without breaking Bitcoin’s broader uptrend. The key takeaway is that short-term structure may resolve either way, but long-term risk management must still account for large drawdowns as part of Bitcoin’s macro behaviour.
FAQs
Most forecasts expect Bitcoin to stay bullish in 2025, with potential highs around $175K if strong demand, ETF inflows, and adoption continue.
While some long-term forecasts are extremely bullish, reaching $1 million by 2030 is speculative. Current credible estimates suggest a potential high around $900,000 by 2030.
Yes, Bitcoin is increasingly viewed as a digital inflation hedge. Its fixed supply contrasts with expanding fiat currencies, attracting investors seeking to preserve purchasing power.


추천 콘텐츠

Trump kicks off morning with new furious attack on Supreme Court
Teen bystander hit as gunman trades fire with Secret Service near Washington Monument