Bitcoin Price Prediction: What to Expect Ahead of the U.S. GDP Report
Bitcoin price has been moving cautiously as investors await the long-delayed U.S. GDP data. The upcoming report, expected to show a 3.2% annualized growth rate for the third quarter, could shake up risk sentiment across markets. Crypto traders are watching closely — because when the macro story shifts, BTC price often reacts first.
Why the GDP Report Matters for Bitcoin Price Prediction
The GDP print is more than just a number. It captures whether the economy’s strength supports continued consumer spending — or whether slowing job growth will finally cool demand. If growth comes in higher than expected, markets could start pricing in tighter monetary policy, which usually puts pressure on Bitcoin price and other risk assets. But if the report confirms that the economy is losing steam, investors may rotate back into Bitcoin as a hedge against weakening fiat strength and potential Fed easing.
Bitcoin Price Prediction: BTC Price Stuck in Tight Range Near $88,000
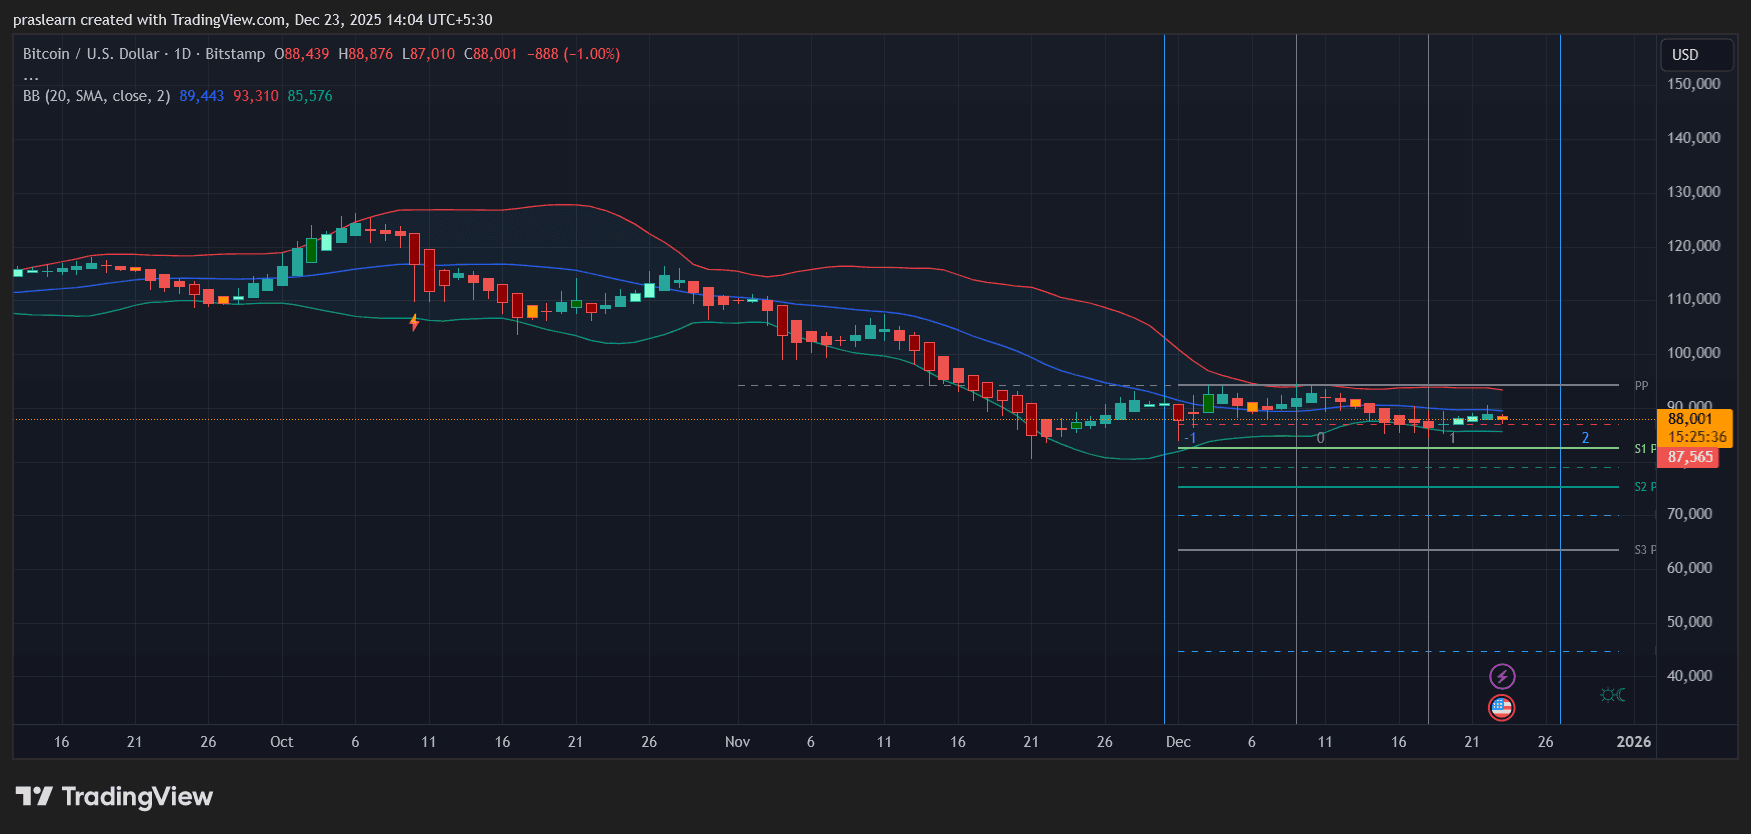 BTC/USD Daily Chart- TradingView
The daily TradingView chart shows Bitcoin price hovering around $88,000, sitting right below its 20-day Simple Moving Average (SMA) of $89,443. The price has been compressing inside the Bollinger Bands, with the upper band near $93,310 and the lower at $85,576, signaling low volatility and a potential breakout zone forming.
For the past two weeks, BTC has been consolidating between $87,000 and $90,000, suggesting traders are waiting for a macro catalyst — exactly what this GDP release could provide. The overall trend since late October has been mildly bearish, with lower highs and shallow rebounds, showing hesitation rather than conviction.
The $87,000 mark is the near-term pivot support, holding multiple times despite brief intraday dips. If Bitcoin closes below this zone, the next key levels are around $82,000 (S1) and $78,000 (S2). On the upside, breaking and closing above $89,500–$90,000 could trigger a move toward $93,000, where the upper Bollinger Band aligns with horizontal resistance from mid-November. A breakout above $93,000 would shift the short-term bias back to bullish and open the path toward $100,000 psychological resistance.
Market Sentiment: Traders Brace for Volatility Spike
Volume and volatility have both been unusually muted, a classic sign of a market waiting for direction. Historically, when Bitcoin compresses this tightly within its Bollinger Bands, a sharp move often follows within days. With macro data on deck, the timing aligns perfectly for a volatility expansion — but the direction depends on the GDP tone.
If the GDP data signals resilience, the dollar could strengthen, pushing Bitcoin toward the lower bands. However, if growth looks overstated or revisions show weakness, traders may interpret that as dovish, sparking a relief rally.
Bitcoin Price Prediction: BTC Price Likely to Stay Range-Bound Until the Data Hits
Until Tuesday’s GDP report, Bitcoin price is likely to remain range-bound between $87,000 and $90,000, with minor wicks outside this zone. A weak GDP number could ignite a bullish breakout above $90,000, while a stronger print risks a dip to $85,000 or lower. Either way, the compression pattern hints that a directional move is imminent.
Bitcoin’s current calm feels deceptive. The Bollinger squeeze, the flat 20-day SMA, and tight price action all point to coiled energy ready to be released. Tuesday’s GDP data might be the trigger that decides whether $BTC resumes its climb toward six figures — or tests deeper support before the next leg up. For now, traders should watch the $87,000–$90,000 range as the battlefield for Bitcoin’s next breakout.


추천 콘텐츠

Cybet Launches Crypto-Powered Online Casino Platform

Trump’s “ Extremely Hard” Hits Hard On Bitcoin, But Some Altcoins Make It Through