

Bears on the Prowl: Is Bitcoin (BTC) Under 2021-Style Bear Pressure?
- Bitcoin has dropped over 2%, holding around the $87K level.
- BTC’s daily trading volume has surged by more than 70%.
- Liquidations totalling $103.77M have hit the BTC market.
The crypto market has been navigating through the red line lately. As of 23rd December, the market has lost 2%, with the fear sentiment lingering across the digital assets. Meanwhile, Bitcoin (BTC), the largest asset, is facing rejections and is stuck in the consolidation phase.
The asset’s price has plunged by over 2.1% in value, falling through critical supports. It opened the day trading at a high of $90,501, and the bearish encounter sent the BTC price down to the $87,061 range. Upon the bears gaining more traction, the price movement would see more downside.
At the time of writing, Bitcoin traded at around $87,409, with its daily trading volume having surged by over 70.13%, reaching the $45.22 billion mark. During the last 24 hours, the market has experienced a liquidation of $103.77 million worth of Bitcoin, as reported by the Coinglass data.
The Ali chart highlights that Bitcoin’s current price structure is mirroring its 2021 cycle. Back then, it topped near $69K, followed by a sharp correction after a distribution phase. In 2025, BTC shows a similar pattern after peaking around $126K, strong rallies, fading momentum, and a potential breakdown zone forming.
Is Bitcoin at Risk of a Deeper Pullback?
The Bitcoin price has continued trading within the bearish phase, and it could fall toward the $87.5K support. If the downside correction strengthens, it might trigger the death cross to take place. Gradually, the bears would send the asset’s price below the $87,435 range.
Assuming the downtrend shifts and gains momentum on the upside, the Bitcoin price could climb to the initial resistance at the $87.7K level. With the steady bullish pressure, a golden cross may form, and the potent bulls send the price toward $87,869 or even higher.
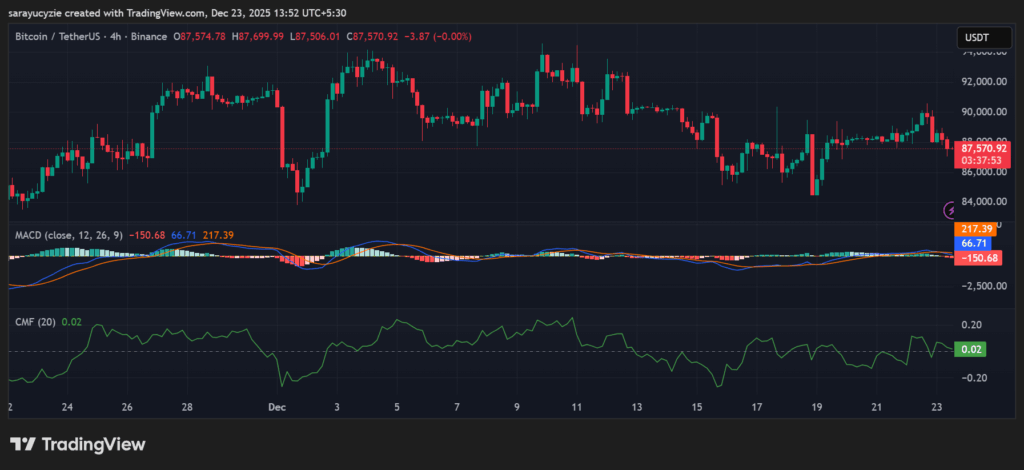 BTC chart (Source: TradingView)
The Moving Average Convergence Divergence (MACD) line of Bitcoin is stationed below its signal line, which indicates the active bearish tone. The wider the gap between the lines, the stronger the bearish pressure. Notably, the Chaikin Money Flow (CMF) indicator positioned at 0.02 suggests a mild buying pressure in the BTC market. Also, the capital inflow slightly exceeds outflows, showing the accumulation is weak.
Bitcoin’s Bull Bear Power (BBP) reading of -1,470.76 signals strong bearish dominance, with the price trading below. This reflects heavy selling pressure and weak buyer participation. Besides, the daily Relative Strength Index (RSI) at 45.31 hints at a neutral to slightly bearish sentiment. BTC is neither overbought nor oversold. A move above 50 strengthens the uptrend, while a drop to 30 increases bearish pressure.
Top Updated Crypto News
Momentum Returns to Humanity Protocol: Will the 17% Rally Extend Further?


추천 콘텐츠

Pope is using Trump spat as opportunity to reclaim Christianity from MAGA: journalist

Stablecoin usage sees significant increases while JPMorgan remains skeptical
