Solana price forms alarming pattern, key metrics plunge
Solana price has crashed in the past few months and has lost half its value from its highest point in August this year.
- Solana’s price has entered a bear market after falling by 50% from the August high.
- The token has formed a bearish flag pattern, indicating further downside.
- Top metrics like transaction count and the number of active addresses has dropped.
Solana (SOL) token was trading at $124.50, and could be at risk of further downside after forming bearish chart patterns on the daily chart. Some of its most important metrics have also dropped in the past few weeks.
Nansen data indicate that the number of transactions declined by 10% over the past 30 days, to 1.79 billion. Despite this decline, Solana remains the most active network in the crypto industry, with transactions exceeding those of the next five chains combined.
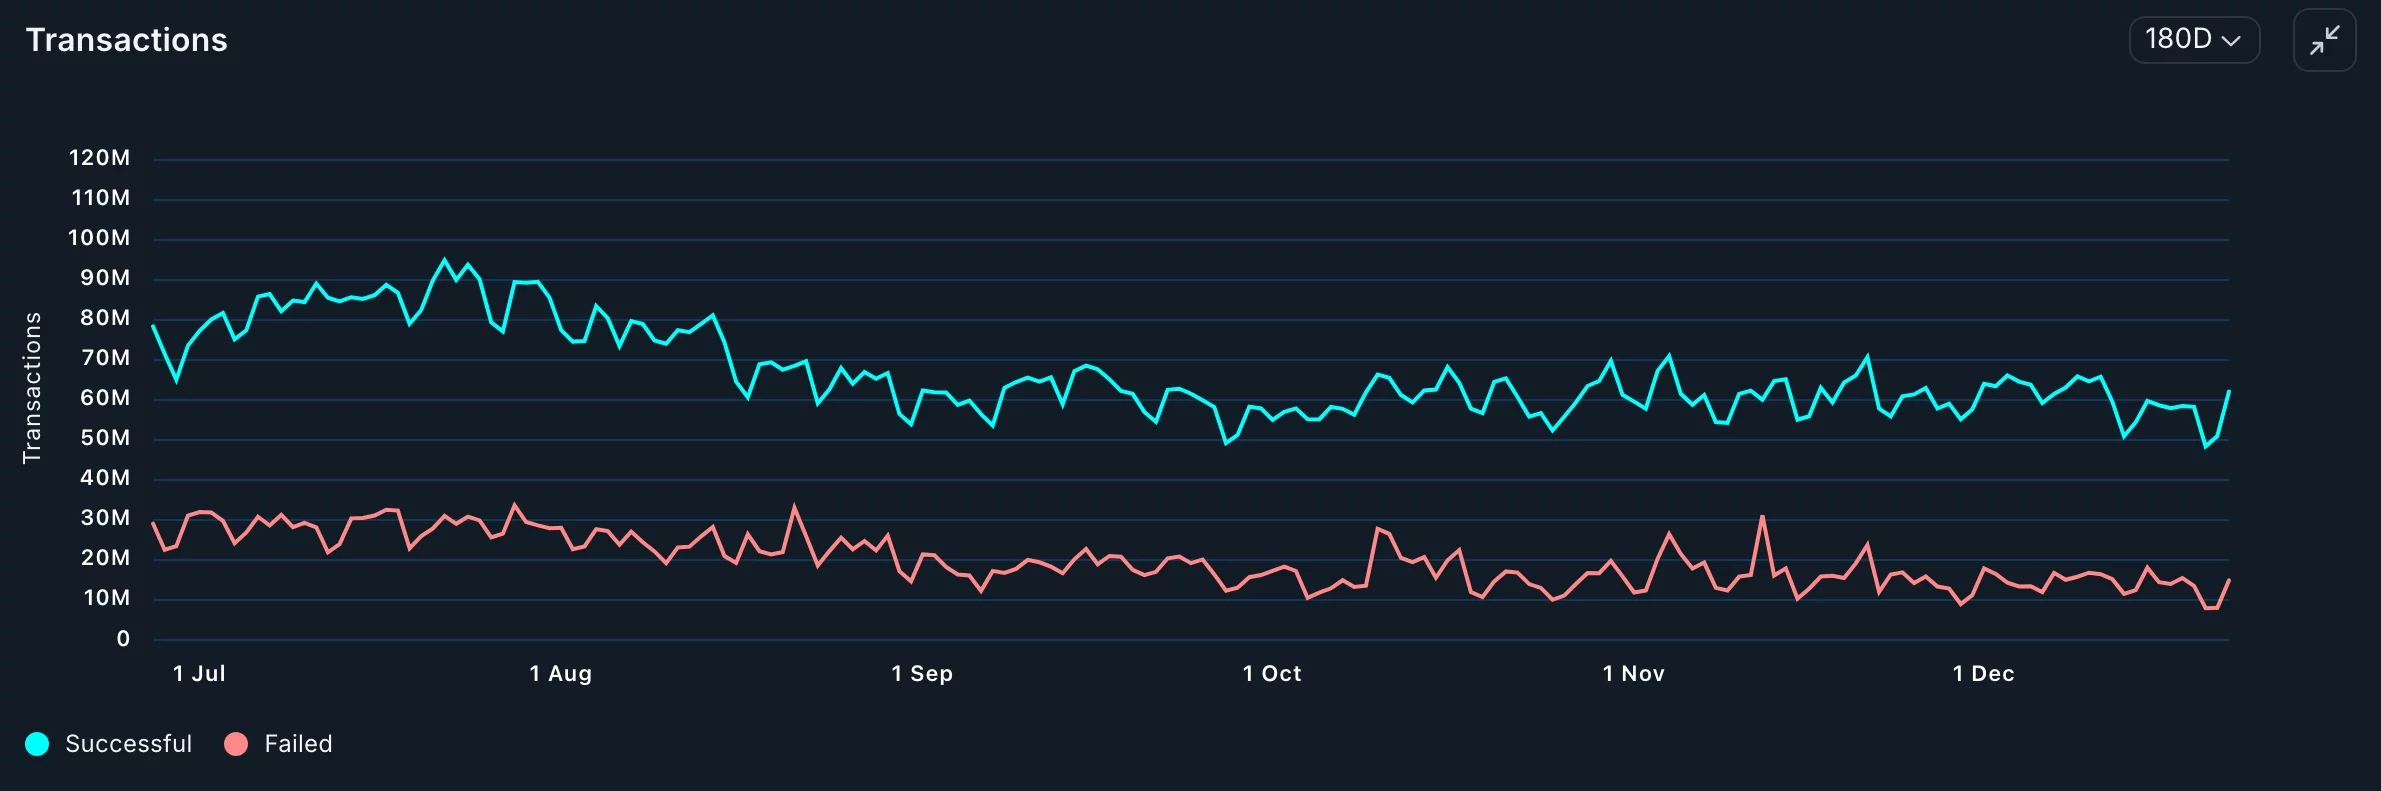 Solana transactions have dropped | Source: Nansen
The number of active addresses in the network declined by 5.7% over the past 30 days to 60.1 million. Most importantly, the fees generated dropped by 21% to $14 million.
Additional data indicate that the total value locked in Solana has declined to $18.57 billion, down sharply from the year-to-date high of $30 billion. On the positive side, the TVL has continued to rise in SOL terms.
While the number of stablecoins on Solana has increased by 15% over the past 30 days, other metrics indicate that activity has declined. The adjusted transaction volume decreased by 30% to $238 billion, while the number of holders fell by 9% to 3.4 million.
This activity is because of the ongoing crypto market crash, which has pushed more people out of the industry. Indeed, Nansen data shows that stablecoin outflows from exchanges have dropped from $94 billion in November to $85 billion today.
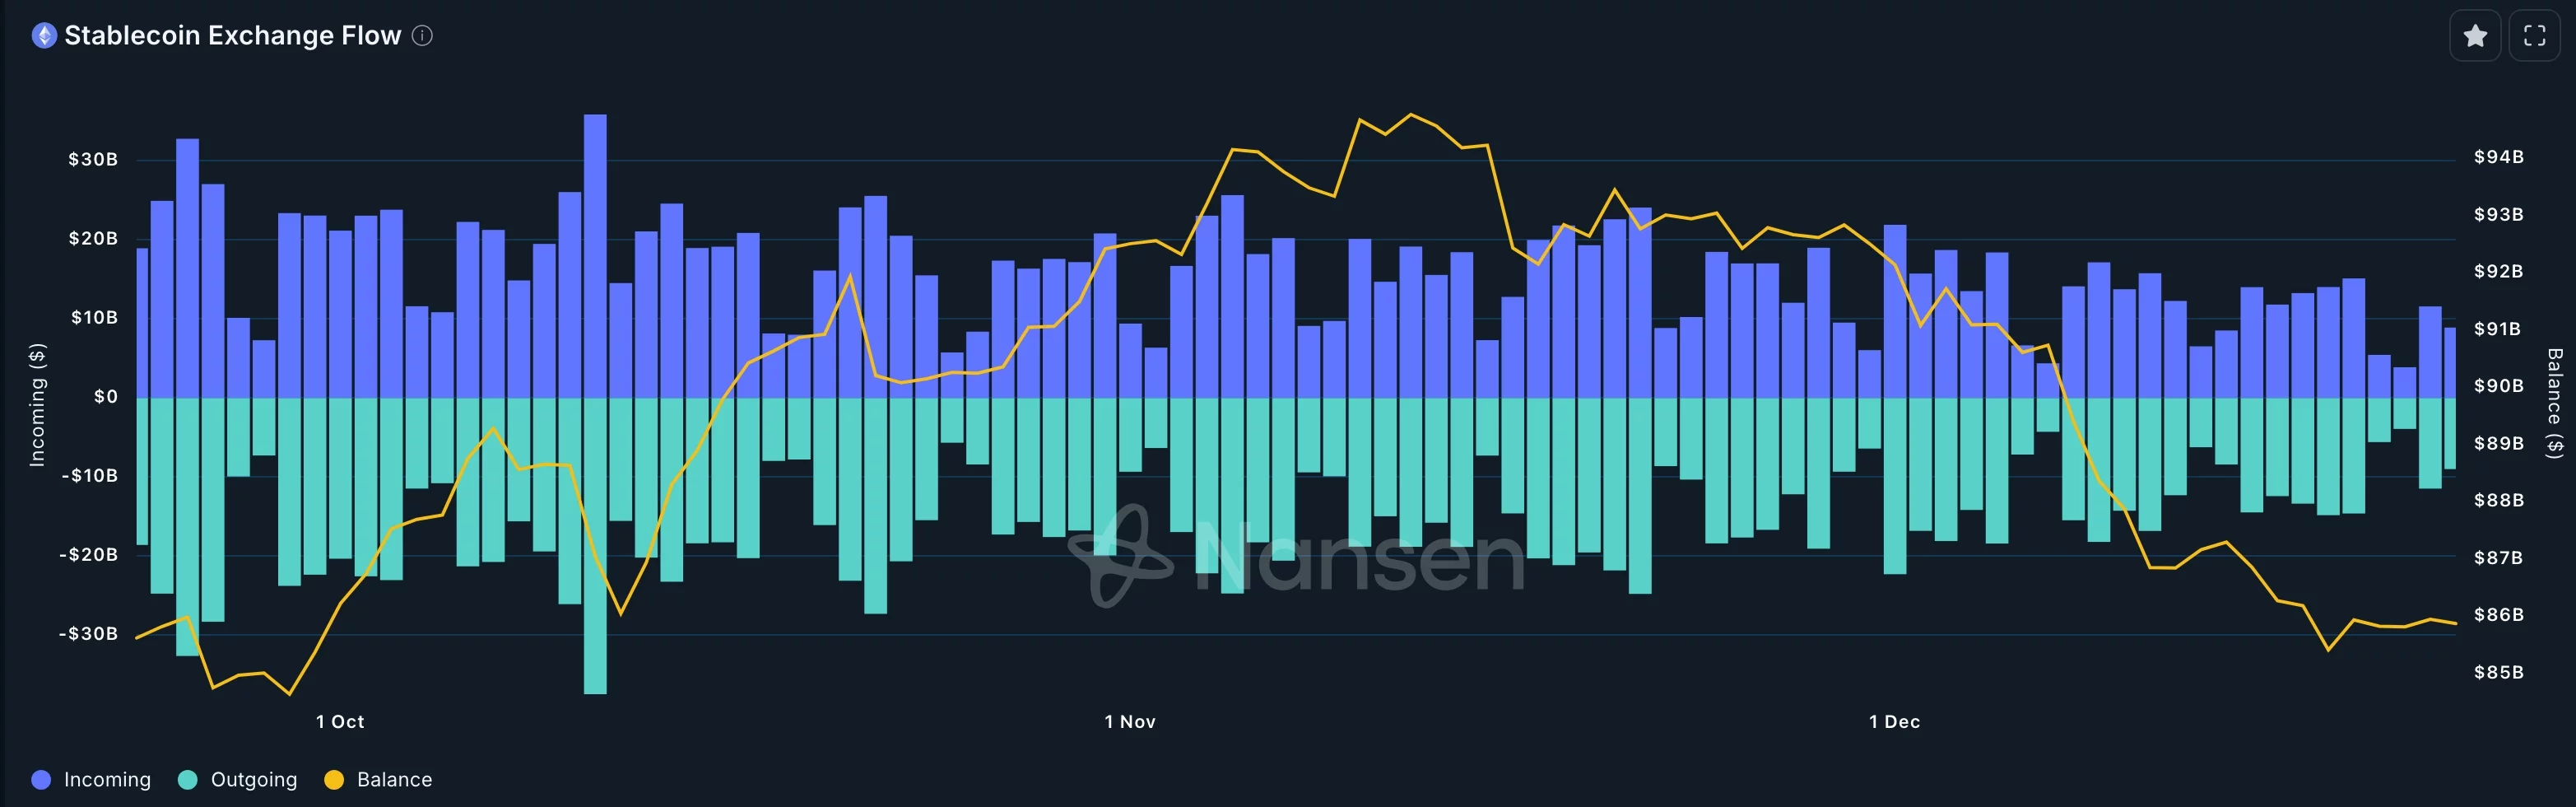 Stablecoin flows in and out of exchanges | Source: Nansen
Solana price technicals points to more downside
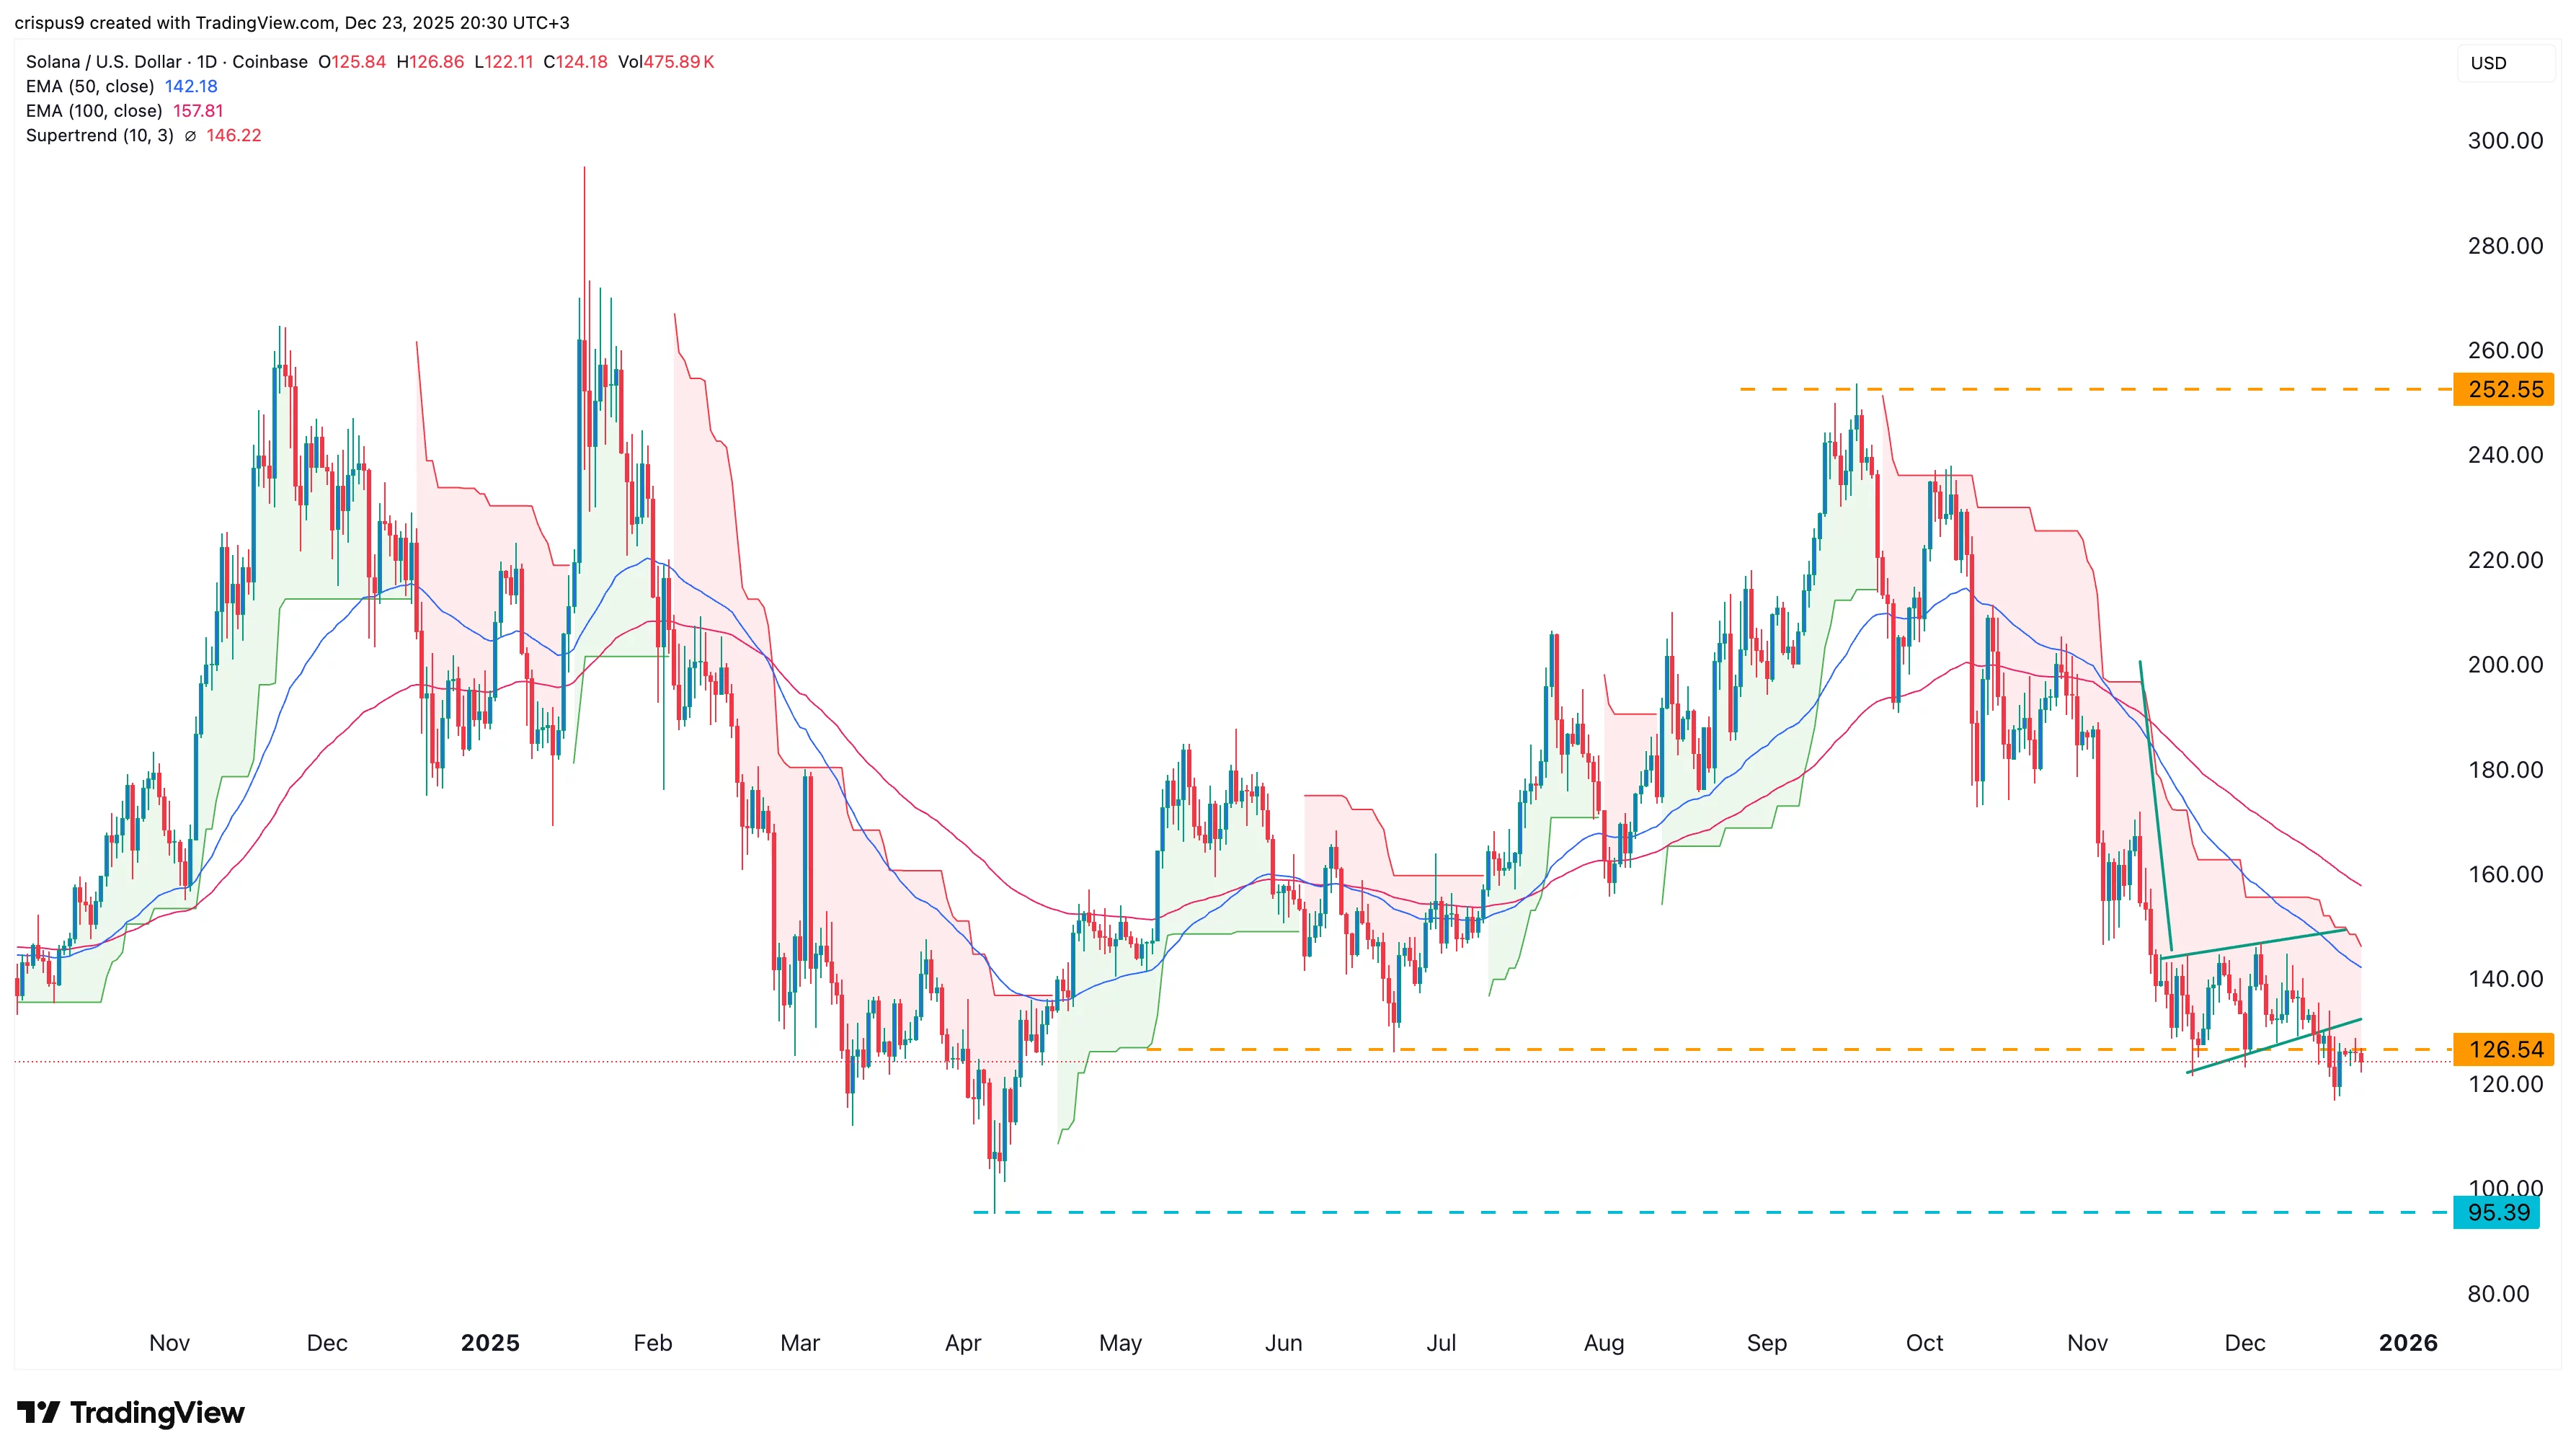 SOL price chart | Source: crypto.news
The daily timeframe chart shows that SOL price has dropped from a high of $252.55 in August to the current $124.30. It has remained below all moving averages.
Solana has formed a bearish flag pattern, a popular continuation sign. It has moved below the lower side of this pattern, confirming a bearish breakout.
Therefore, the token will continue to fall as sellers target the psychological level of $100. Such a move will be a 20% decline from the current level.


추천 콘텐츠

Bitcoin 28% Haircut: Moody’s Sets Forced-Selling Trigger

Crypto, tech, and software stocks rose as the S&P 500 and Nasdaq closed at record highs