XRP price at risk as key RLUSD stablecoin metrics plunge
XRP price declined for the third consecutive day as sentiment in the crypto market waned, and key Ripple USD metrics continued to worsen.
- The XRP price has crashed by double digits in the past few months.
- Ripple USD’s transaction volume plunged by 85% in the last 30 days to $3.4 billion.
- The XRP token has formed several bullish patterns, pointing to a strong bullish breakout.
Ripple (XRP) token dropped to $1.8800, its lowest level since Dec. 19, and ~50% below its highest point this year. This decline mirrored the performance of Bitcoin (BTC) and other altcoins.
XRP price has also dived as key metrics of the Ripple USD (RLUSD) network deteriorated. Data compiled by Artemis indicate that the supply of RLUSD in circulation has increased by 16.5% over the past 30 days to $1.4 billion.
However, the adjusted transaction volume has plunged by 85% to $3.4 billion. This decline coincided with a 30% drop in transactions to 375,000. The number of RLUSD addresses fell by 27% to 5,000.
RLUSD volume and transaction count will likely increase in the coming year upon its launch on several layer-2 networks, including Optimism, Base, and Unichain. This launch will happen in collaboration with Wormhole (W).
Another bullish catalyst for the XRP price is that American investors have continued accumulating it. They purchased XRP ETFs totaling more than $43 million on Monday, bringing the cumulative inflows to $1.12 billion.
These funds now hold $1.25 billion in assets, with Canary, 21Shares, and Bitwise being the biggest ones. Most importantly, they have never had a day of outflows since the approval in November.
XRP price technical analysis
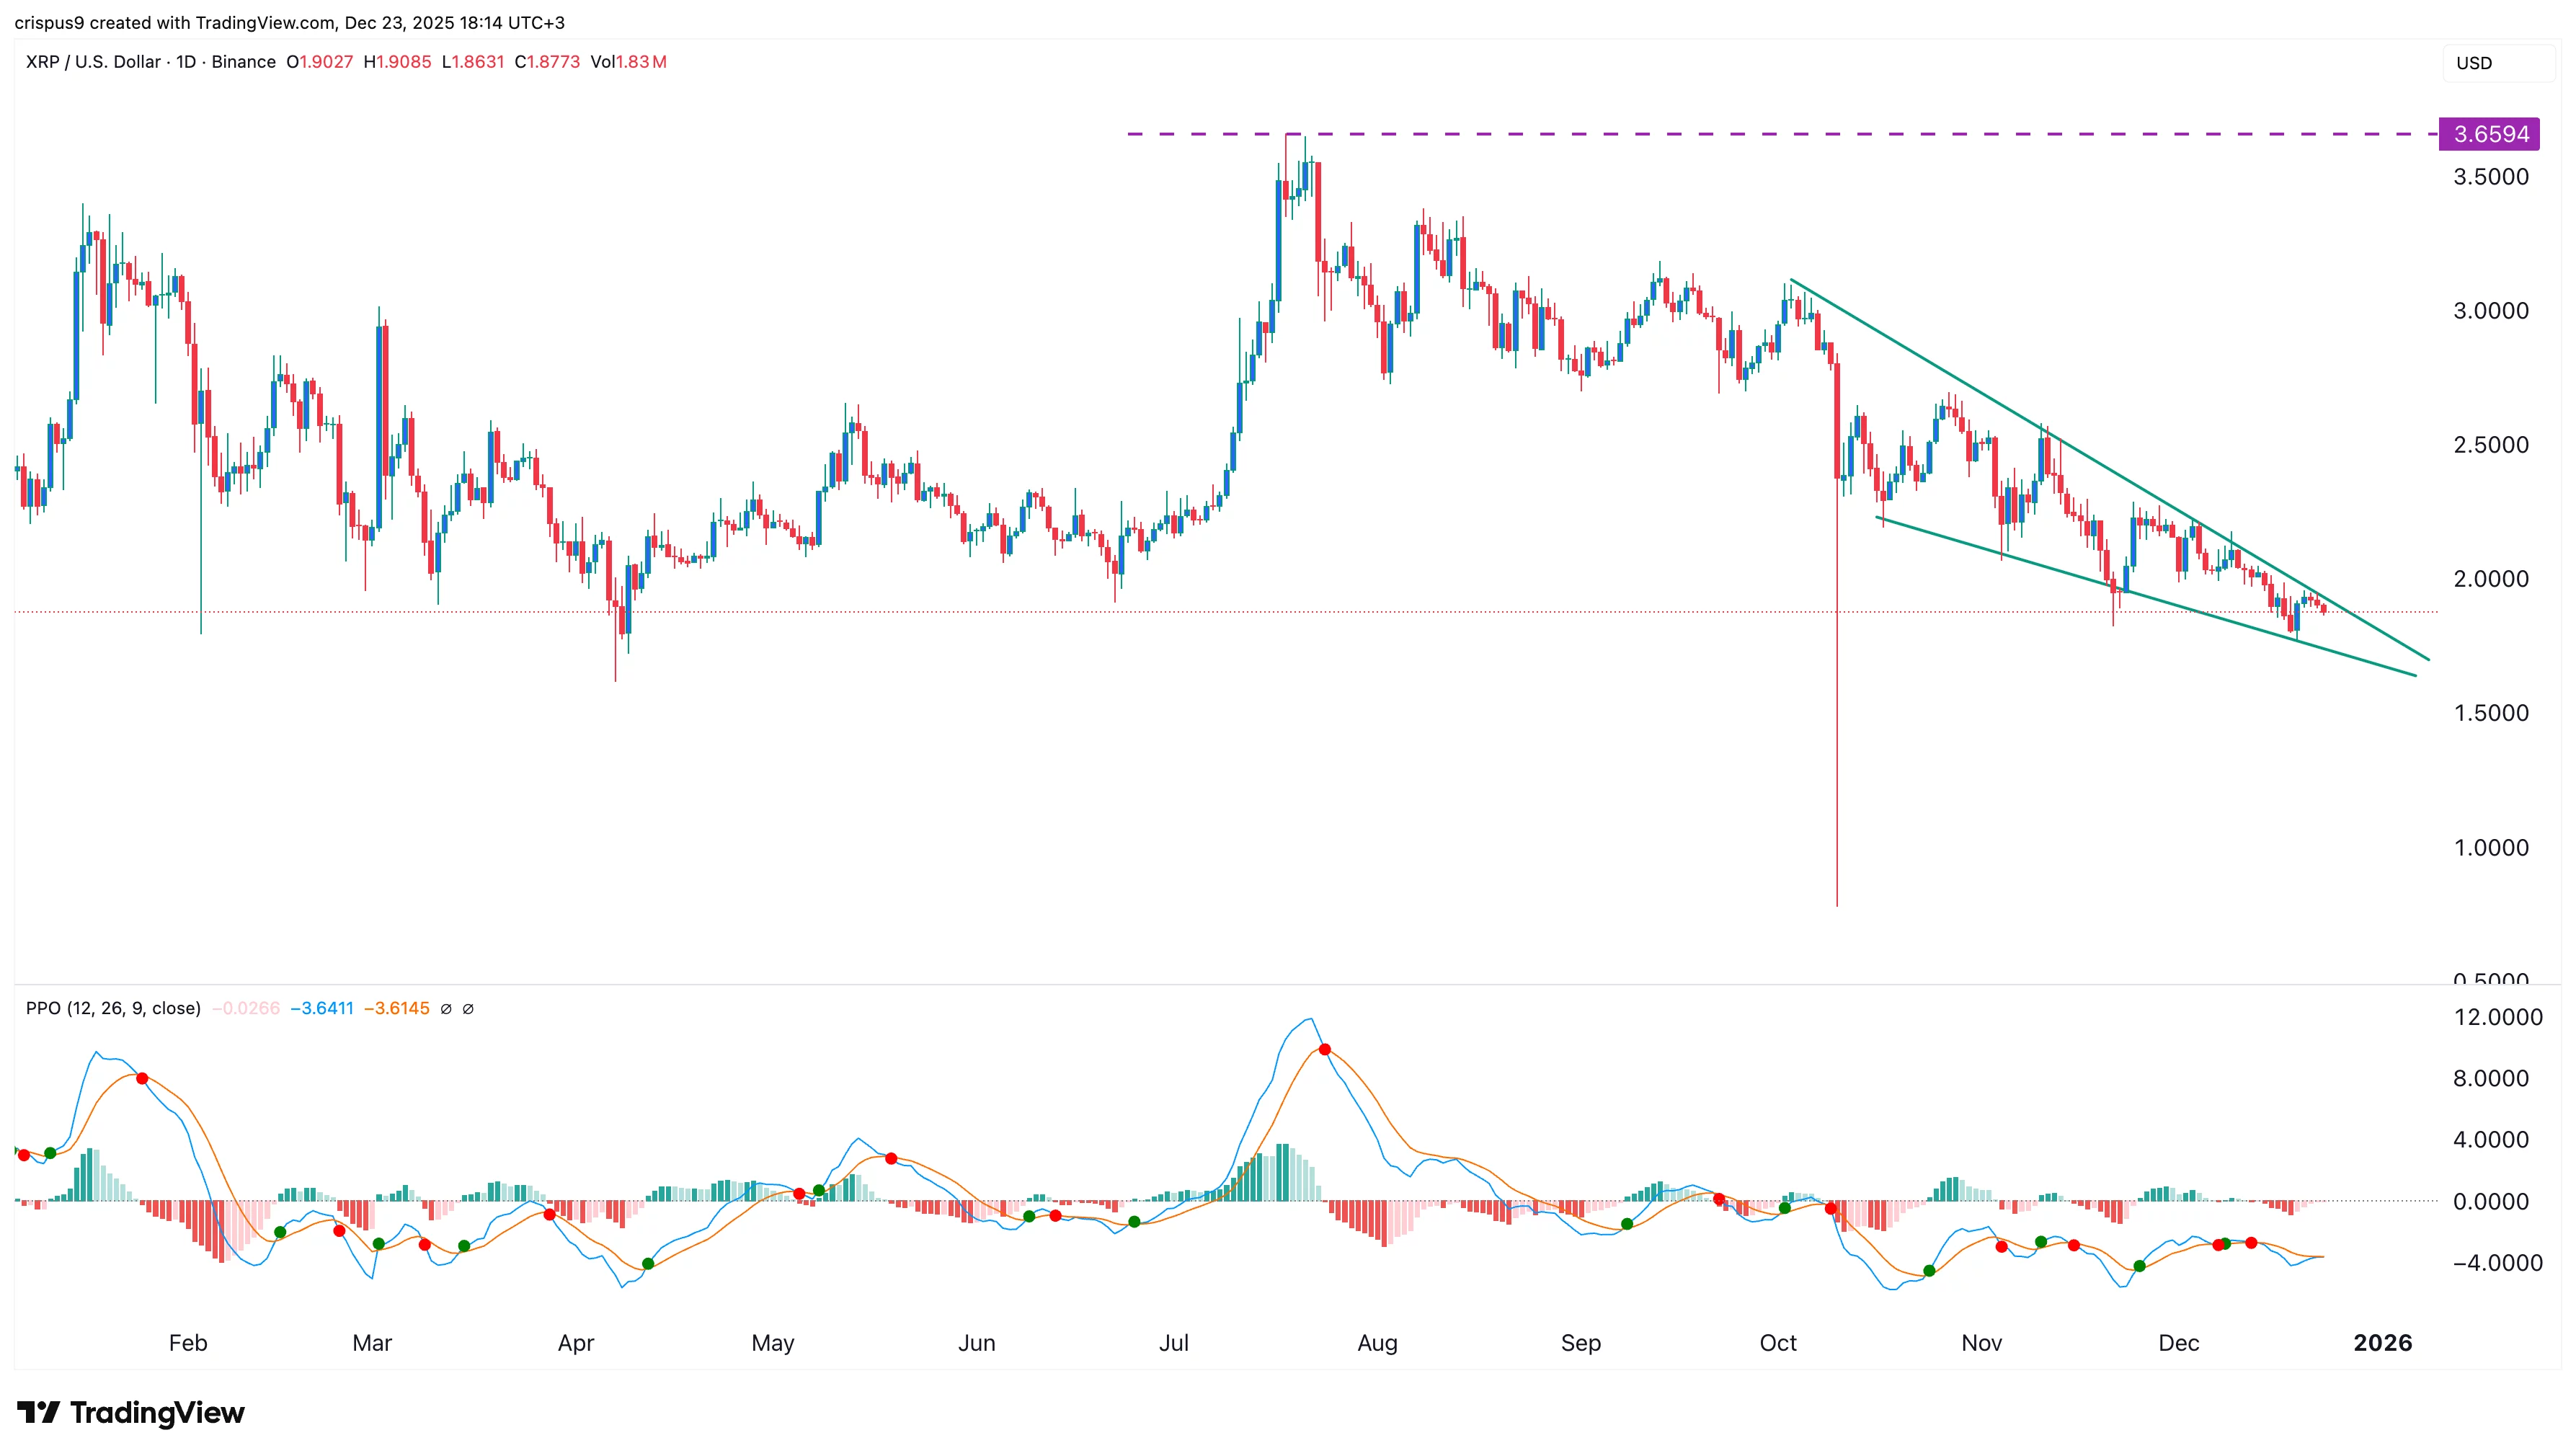
The daily timeframe chart indicates that the XRP price has declined over the past few months. It has dropped from the year-to-date high of $3.65 to the current $1.8670.
There are signs that its sell-off is about to end, as the token has formed a falling wedge pattern, characterized by two descending, converging trendlines. These trendlines are about to converge, which suggests that a bullish breakout may be imminent.
XRP price has also formed a bullish divergence pattern, which occurs when an oscillator rises while the price continues to fall. In this case, the Percentage Price Oscillator has risen over the past few weeks.
The token has also formed an inverse head-and-shoulders pattern, another bullish reversal sign. Therefore, it will likely rebound as bulls target the next critical resistance level at $2 followed by $2.50.


추천 콘텐츠

Bitcoin 28% Haircut: Moody’s Sets Forced-Selling Trigger
Crypto, tech, and software stocks rose as the S&P 500 and Nasdaq closed at record highs