3 Bitcoin Indicators Signal a Potential BTC Market Bottom

Bitcoin Shows Signs of Bottoming Out Amid Decisive Technical Indicators
Bitcoin appears to be nearing a local bottom after a sharp decline exceeding 35% from its recent peak of approximately $126,200, recorded two months ago. A combination of technical patterns and on-chain activity signals suggests the cryptocurrency may be poised for a reversal, with key market exhaustion points indicating the potential for a recovery in the coming weeks.
Key Takeaways
- Technical momentum, miner capitulation, and liquidity indicators signal decreasing selling pressure.
- Macro liquidity conditions hint at a possible Bitcoin rebound within the next 4 to 6 weeks.
- Historical patterns show that similar technical setups have preceded bullish reversals.
- On-chain activity and hash rate data support the premise that the market may have reached a capitulation point.
Strengthening Technical and On-Chain Signals
Recent weekly chart analysis reveals that Bitcoin’s Stochastic RSI has moved away from oversold territory, a bullish sign historically preceding major lows. As trader Jesse pointed out, such bullish crossovers occurred after previous correction lows—including the 2019 bottom near $3,200, the COVID-19 crash at around $3,800, and the late 2022 low near $15,500—each followed by significant rallies. Additionally, the three-day chart now shows a bullish divergence: prices hit lower lows, but momentum indicators have not, implying diminishing selling pressure and the potential for a trend reversal.
Weekly BTC/USD chart. Source: TradingViewMoreover, Bitcoin’s mining activity has shown signs of capitulation, with the network’s hashrate declining by approximately 4% in December. Analysts from VanEck consider this a bullish contrarian indicator, as sustained hash rate drops often precede stronger price recoveries. Historically, after similar declines since 2014, Bitcoin posted positive returns over the following three to six months, with longer periods showing average gains of roughly 70%. This may also improve miner profitability, encouraging hardware reactivation and network security.
Macro Indicators Signal a Potential Rally
Increasing liquidity conditions outside the immediate crypto sphere bolster the case for an imminent rebound. The Chicago Fed’s National Financial Conditions Index (NFCI) has historically acted as a leading indicator, with recent readings below -0.50 matching periods of upcoming price surges. A decline of just 0.10 points in this index has previously coincided with 15–20% upside in Bitcoin, highlighting the importance of macroeconomic factors in driving crypto markets.
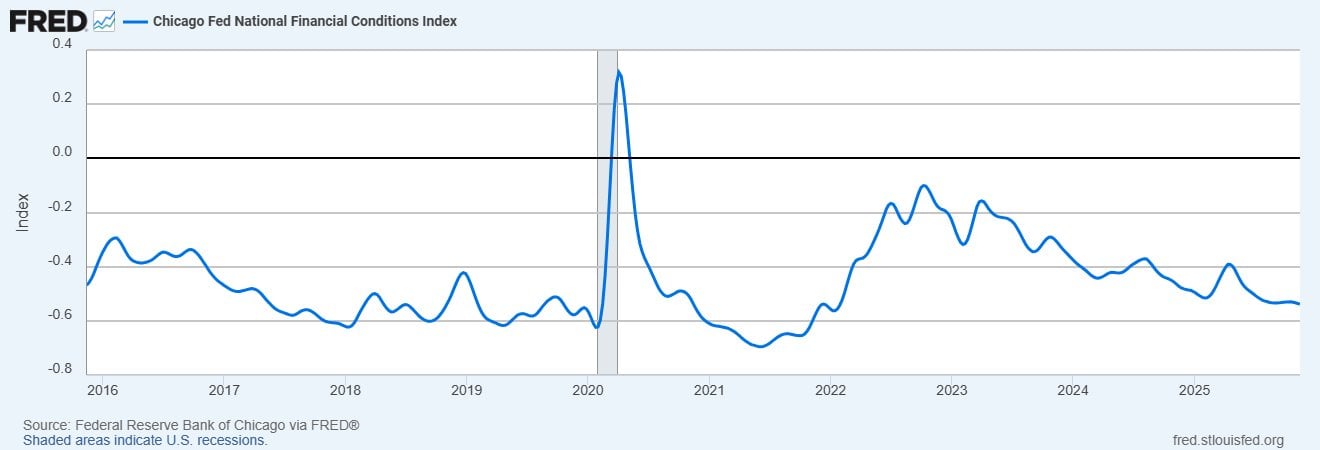 Chicago Fed NFCI vs. Bitcoin price. Source: X
Of particular interest is the Federal Reserve’s plan to shift holdings of mortgage-backed securities into Treasury bills, a move that analyst Miad Kasravi likens to the 2019 “not-QE” liquidity injection, which preceded a 40% rally in Bitcoin. While many experts remain cautious and predict further declines with targets dropping to $70,000 or even $25,000, these macro signals highlight the potential for a bullish phase in the coming weeks.
Despite optimistic indicators, markets remain volatile, and diverse forecasts continue to project significant downside risk. Investors should remain cautious, conducting thorough research before making any trading decisions. The evolving macro landscape and technical backing suggest that Bitcoin might be setting the stage for a substantial rebound within the next month or two.
This article was originally published as 3 Bitcoin Indicators Signal a Potential BTC Market Bottom on Crypto Breaking News – your trusted source for crypto news, Bitcoin news, and blockchain updates.


추천 콘텐츠

BitGo Launches Revolutionary Institutional Stablecoin Service for Major Financial Players

Stablecoins surpass Bitcoin in purchases across Latin America