XRP Price Prediction: XRP Loses $1.95 Weekly Support as Downside Risk Builds Toward $1.60
The breakdown below the $1.95 zone, an area reinforced by Fibonacci retracement levels and long-term moving averages, has placed XRP at a technical crossroads. This level mattered not only technically but also behaviorally, as it had consistently attracted dip-buying throughout 2025. With that support now compromised, market participants are closely watching whether buyers can stabilize price action or if downside momentum accelerates toward lower support zones.
XRP Price Today
At the time of writing, XRP is trading near $1.86, reflecting a 1.25% decline during the latest 24-hour session, according to Brave New Coin data. Trading volume over the same period stands at approximately $2.08 billion, suggesting sustained liquidity even as price weakens. The move places XRP below a level that had repeatedly acted as a price floor earlier this year, raising questions about near-term stability.
XRP was trading at around 1.85, down 1.25% in the last 24 hours at press time. Source: XRP price via Brave New Coin
From a broader market perspective, the XRP market cap has softened alongside price, while volatility has begun to expand. Historically, similar weekly breakdowns in XRP have led to heightened intraday swings as leveraged positions adjust, rather than immediate directional follow-through.
Technical Structure Shows Breakdown Risk
On the weekly chart, XRP has slipped below the $1.95 support zone, which aligns with the 0.5 Fibonacci retracement and the 89-week exponential moving average (EMA). These levels are widely monitored because they often mark equilibrium points during corrective phases within broader market cycles. A loss of such confluence tends to weaken bullish conviction.
XRP tests $1.95 support, with a weekly close below risking $1.60 and a close above potentially sparking a bounce toward $2.30. Source: @CryptoXLARG via X
Technical analyst CryptoXLARG, who focuses on higher-timeframe crypto market structure on X, highlighted the significance of the move. The analyst noted that XRP remains capped below the descending trendline and the 8–21 EMA band, a zone commonly used to gauge short- to medium-term trend strength.
“$1.95 has been a structural support all year,” the analyst explained. “Losing it on a weekly basis shifts the technical bias lower.”
A confirmed weekly close below this level increases the probability of a move toward the 0.618 Fibonacci retracement near $1.60, a level that often acts as a deeper corrective target rather than a trend reversal point.
Lower Timeframe Pressure Persists
Shorter timeframes continue to reflect underlying weakness. On the 4-hour chart, XRP remains confined within a descending channel, with multiple failed attempts to reclaim the $2.00–$2.05 resistance zone. This area has consistently attracted selling interest during recent rebounds.
XRP remains in a downtrend, repeatedly rejected at $2.00–$2.05 resistance, with potential downside toward $1.55–$1.50 unless it closes above $2.05. Source: @suryapro via X
Crypto market analyst Surya, who frequently publishes short-term technical breakdowns on X, noted that XRP “still hasn’t escaped the downtrend.” According to the analyst, as long as the $2.00–$2.05 range caps upside, downside scenarios toward $1.55–$1.50 remain technically valid.
These repeated rejections suggest that bullish momentum has yet to establish acceptance above resistance, limiting the durability of relief rallies.
Key Support Levels Under Watch
Attention has now shifted to the $1.86–$1.87 region, which coincides with short-term historical support. Data from CoinDesk shows XRP recently closed near $1.87, placing this zone under immediate pressure as sellers retain control.
XRP faces strong selling pressure at the descending trendline, with price needing to hold key 4H support and break above resistance to unlock upside momentum. Source: Leo524 on TradingView
TradingView technical analyst Leo524, known for monitoring trendline interactions and intraday support zones, emphasized the importance of this area. The analyst observed that XRP has been rejected twice from the descending trendline and is now reliant on a critical 4-hour support band below current prices.
“Price must hold this support to avoid further downside,” the analyst wrote, adding that upside continuation would require a clean breakout above the trendline, rather than brief intraday spikes.
Final Thoughts
XRP’s move below the $1.95 weekly support has shifted market focus toward risk management rather than upside expansion. With price hovering near $1.86, the immediate question is whether this short-term support can stabilize price and slow downside momentum. A sustained hold above this zone would suggest consolidation rather than continuation.
Conversely, a decisive weekly close below current levels would strengthen the case for a deeper retracement toward the $1.60 Fibonacci level, where buyers may reassess risk exposure. Until XRP reclaims former support and breaks above the descending trendline, price action is likely to remain cautious, with traders awaiting clearer confirmation from higher-timeframe closes and broader market conditions.


추천 콘텐츠

Open Payments Come to the Classroom at Over 10 Universities, With the Interledger Foundation
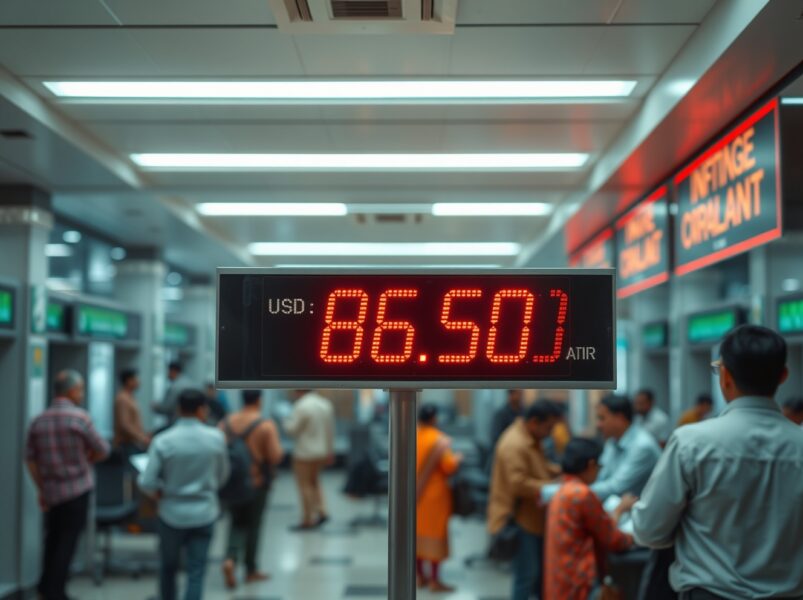
USD/INR Surrenders Gains but Holds Near Record Highs: A Critical Juncture for the Indian Rupee