

Cardano price flashes bullish reversal signal while TVL, stablecoin supply drop
Cardano price has dropped 60% since its October high as its TVL and stablecoin supply weakened. However, it has been forming a bullish reversal pattern which, if confirmed, could lead to a 45% rally ahead.
- Cardano price has dropped by 25% from its December high.
- Its stablecoin market and TVL has declined since August.
- A bullish reversal pattern has formed on the daily chart.
According to data from crypto.news, Cardano (ADA) has been in a downtrend, dropping nearly 25% from its December high and 63% from its highest point in October. Its market cap has shed from $35.1 billion to around $12.9 billion at press time.
Cardano price dropped as its fundamentals continue to weaken
According to data from DefiLlama, the total value locked across all DeFi protocols built on the blockchain dropped to $215.5 million from its August high of $544 million. Declining TVL hints at lower user participation and could point to investors losing confidence in the network’s growth potential.
The total market cap of stablecoins on the blockchain has also dropped, from a November high of $40.48 million to $37.68 million at press time.
Leveraged traders have also seemed to have lost interest in the token. Data from CoinGlass shows that ADA Futures open interest has dropped from $1.72 billion observed in October to $651 million when writing.
Together, these deteriorating metrics have kept investors cautious and sentiment fragile, which has weighed heavily on price performance.
Cardano price analysis
Despite the broader weakness in on-chain stats and investor activity, charts have painted a bullish outlook for the token.
On the daily chart, Cardano price has been forming a falling wedge since early October this year. The pattern is formed of two converging and descending trendlines.
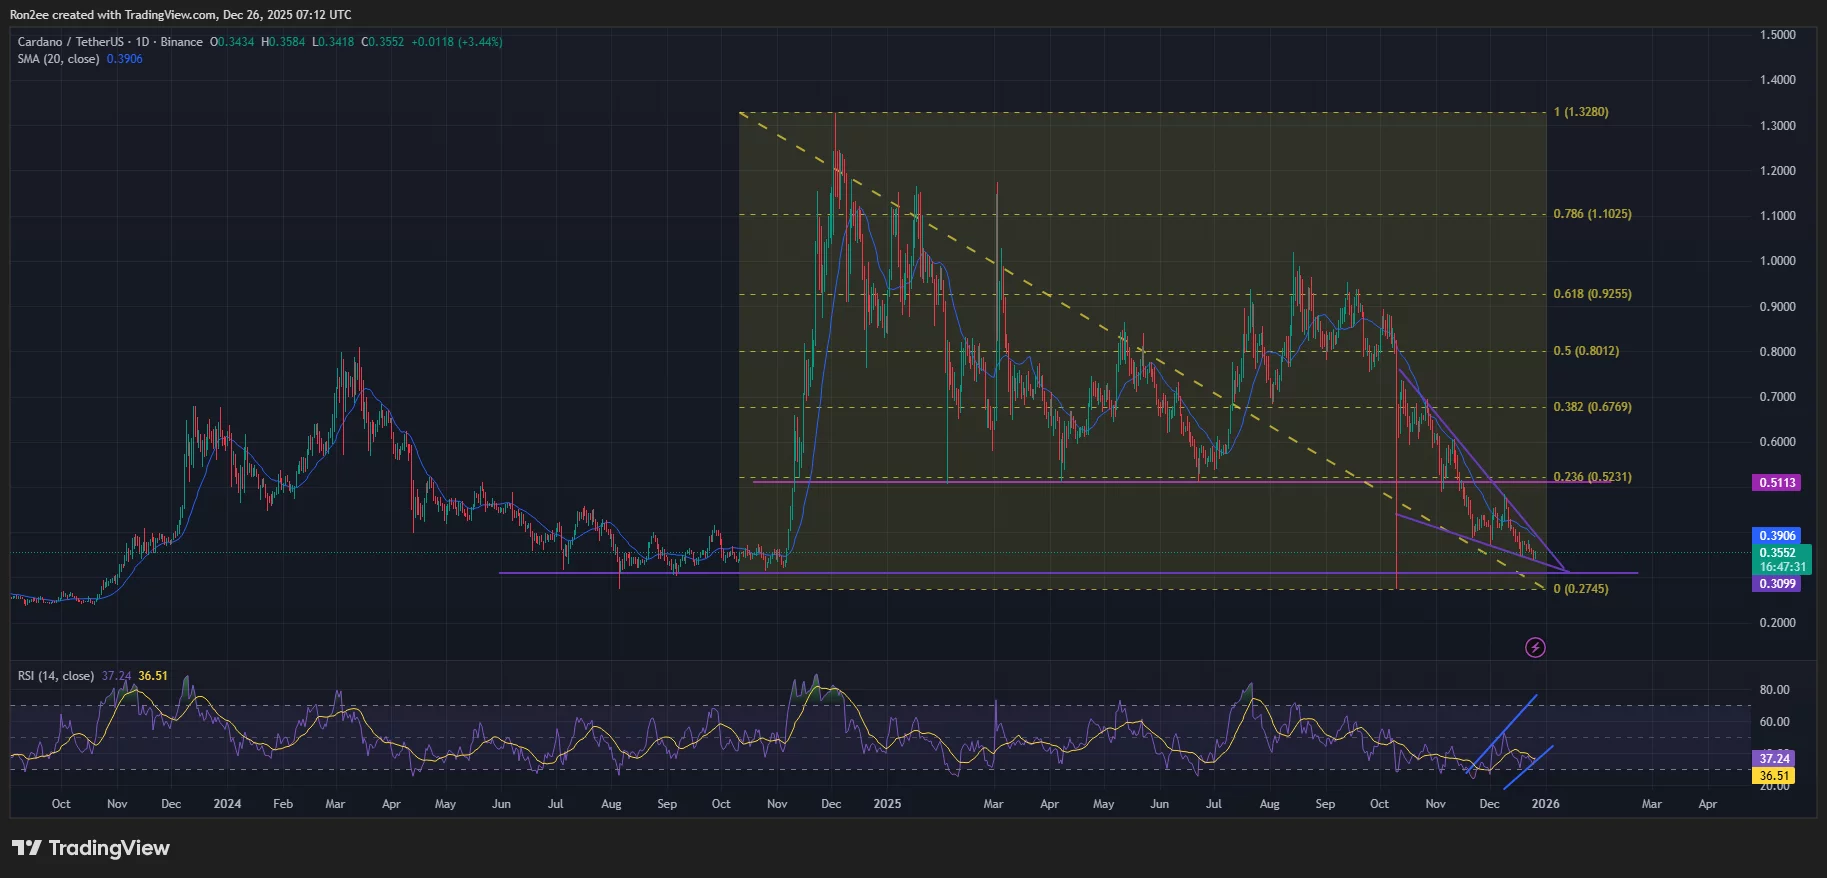
Historically, when an asset breaks out of such a structure from the upper side, it often signals that the ongoing downtrend has lost its momentum.
A look at momentum indicators such as RSI, which has formed a bullish divergence, also indicates a potential rebound could be on the way.
For now, Traders will be closely watching the 20-day SMA at $0.39, a break above which would confirm a breakout from the wedge pattern.
In that case, ADA could potentially rally to $0.51, a target calculated by adding the height of the wedge to the pattern breakout price. At press time, it stood nearly 45% above the current price.
On the contrary, a breakdown below the lower trendline of the pattern could lead to a fall to $0.30, a level that has acted as a strong support floor throughout last year.
Disclosure: This article does not represent investment advice. The content and materials featured on this page are for educational purposes only.


추천 콘텐츠

Bitcoin Drops to $67K as Oil Surges Following Trump Speech

LINK Outflow Hits 2026 High at 970,000 Tokens


