

Measuring True Campaign Uplift in Noisy E-Commerce Data: A Practical Heuristic Approach
How we built a heuristic attribution system to filter fake discounts and estimate true incremental sales impact.
Introduction
In large e-commerce marketplaces, measuring campaign impact is far from trivial.
Standard attribution approaches assume that campaign flags and price drops are reliable indicators of real incentives. In practice, pricing data is often strategic rather than truthful. Fake discounts, overlapping promotions, and volatile merchant behavior make it difficult to answer a deceptively simple question:
Working on a large-scale marketplace with millions of SKUs and thousands of merchants, we found that automated attribution outputs frequently overstated campaign success. Instead of optimizing for visibility or Gross Merchandise Value (GMV), we needed a way to measure true incremental impact.
Rather than relying on opaque attribution logic, we designed a transparent, rule-based heuristic system focused on one core principle : establishing a clean counterfactual baseline before measuring uplift.
\
Phase 1: The Real Challenge — Defining a Clean Baseline
Campaign uplift is conceptually simple:
Impact = Actual Sales − Baseline Sales
Actual sales are observable. \n Baseline sales —what would have happened without the campaign — are not.
To estimate this baseline, we analyze the previous 60 days of sales history. However, historical data is often polluted by prior campaigns, pricing tricks, and low-impact promotions. A naive average would simply embed this noise into the baseline.
Our first task, therefore, was to identify True Non-Campaign Days.
\
Algorithm 1: Volume Significance Filter
Not every campaign tag represents a meaningful promotion.
In many cases, a SKU is technically under a campaign, but only a handful of users applied a niche promo code. Treating such days as campaign days distorts organic demand.
Rule:
\ This simple filter removes low-impact noise and preserves genuine demand patterns. But we learned the hard way that relying on a single signal — either campaign flags or price drops — consistently leads to false positives.
\
Algorithm 2: Dynamic Price Anomaly Detection
Price drops alone are unreliable signals in large marketplaces.
Merchants may:
- Reduce prices marginally and label it a “major campaign”
- Increase prices shortly before a campaign, then “discount” them back to normal
To address this, we evaluated pricing behavior relative to historical norms, not marketing labels.
Step 1: Establish a Price Anchor
For each SKU, we calculate the median unit price over the last 60 days (P_median).
The median is robust to outliers and short-term manipulation.
\
Step 2: Apply Category-Level Dynamic Thresholds
Price volatility varies significantly by category. A 5% change may be meaningful in electronics but irrelevant in fashion.
We compute a volatility-based threshold per category and compare daily prices against it:
If (Pmedian − Pdaily) < Threshold_category, the day is classified as a False Campaign and included in the organic baseline.
\ Example:
- Median price: 100 TL
- Category threshold: 5%
| Daily Price | Classification | |:---:|:---:| | 98$ | Non - Campaign (Fake Discount) | | 90$ | True Campaign |
This ensures that days with “normal” pricing behavior remain part of the organic baseline — even if tagged as discounted.
\
Phase 2: Constructing the Counterfactual Baseline
Once clean non-campaign days are identified, the next challenge is estimating baseline sales for the target day.
In e-commerce, weekly seasonality is critical. Mondays behave very differently from Sundays.
Our baseline logic follows three rules:
-
Same - Day Priority
We prioritize historical observations from the same weekday.
-
Availibility Check
Days when the product was out of stock or unlisted are excluded.
-
Controlled Avaraging
We average up to 7 clean, same-weekday observations.
This approach mirrors the intuition of causal methods like Difference-in-Differences, while remaining computationally lightweight and easy to explain.
\
Phase 3: Separating Direct vs Indirect Campaign Impact
Total uplift alone can be misleading.
A campaign may directly discount some purchases, while also triggering additional demand through visibility, urgency, or halo effects. To make this distinction explicit, we split uplift into two components.
| SKU | Actual Sales | Baseline Sales | Discounted Units | Direct Impact | Indirect Impact | |:---:|:---:|:---:|:---:|:---:|:---:| | SKU A | 18 | 10 | 4 | 4 | 4 |
\ Rather than reporting a single ‘+8 uplift,’ we explicitly separate:
- sales mechanically driven by the campaign
- additional demand occurring around the campaign without direct incentives
This split makes campaign effects easier to interpret, compare, and trust — especially when uplift looks unexpectedly high.
\
Phase 4: Attribution Under Overlapping Campaigns
Campaigns rarely operate in isolation. \n A single SKU may simultaneously be part of multiple promotions — platform-wide discounts, bank-funded offers, or merchant-level campaigns.
After separating direct and indirect impact, the remaining challenge is allocating impact fairly across overlapping campaigns.
\
Discounted Units–Based Attribution
We use discounted units as the primary attribution signal.
\
\ This anchors attribution to observed customer behavior, rather than abstract incentive structures.
\
| Campaign | Discounted Units | Attribution Weight | Attributed Direct Impact | Attributed Indirect Impact | |:---:|:---:|:---:|:---:|:---:| | Campaign A | 3 | %75 | 3 | 3 | | Campaign B | 1 | %25 | 1 | 1 | | TOTAL | 4 | %100 | 4 | 4 |
\
Why This Attribution Works
This approach:
- keeps direct and indirect impact numerically consistent
- avoids fractional units entirely
- ensures total impact is fully decomposable
- remains easy to explain and audit
As a result, overlapping campaigns can be evaluated transparently without additional modeling complexity.
\
Phase 5: Seasonality Adjustment
Baseline sales alone are not always comparable across days.
In large e-commerce platforms, traffic fluctuates significantly due to payday effects, platform-wide events, or external factors. Without adjustment, these fluctuations can be mistakenly interpreted as campaign impact.
To avoid this, we explicitly account for seasonality when estimating baseline sales.
Traffic-Based Seasonality
We measure seasonality using traffic, not sales.
\
\ Instead, we compute a seasonality ratio at the subcategory level based on daily traffic patterns.
Method
- Compute average daily traffic for each subcategory over a recent historical window
- Calculate the ratio of current-day traffic to this historical average
- Adjust baseline sales using this ratio
Why This Matters
This adjustment:
- separates traffic-driven demand from campaign-driven uplift
- prevents high-traffic days from inflating campaign impact
- keeps the counterfactual baseline aligned with real user exposure
As a result, campaign uplift reflects incrementality, not background traffic noise.
\
Conclusion: Measuring What Actually Changed
Measuring campaign impact in large e-commerce platforms is not a modeling problem, it is a counterfactual problem.
When discounts are noisy, campaigns overlap, and merchants adapt strategically, naive attribution logic tends to overstate success. Instead of asking “Which campaign gets the credit?”, we reframed the problem as:
By focusing on:
- identifying true non-campaign days,
- constructing clean, comparable baselines,
- separating direct and indirect effects,
- and attributing impact based on observed customer behavior,
we built a system that prioritizes trust over complexity.
This approach does not rely on perfect experiments or heavy causal models. \n It relies on transparent assumptions, simple heuristics, and metrics the business can reason about.
In noisy marketplaces, the most valuable analytics systems are not the most sophisticated ones they are the ones that make uncertainty explicit and decisions defensible.
\ 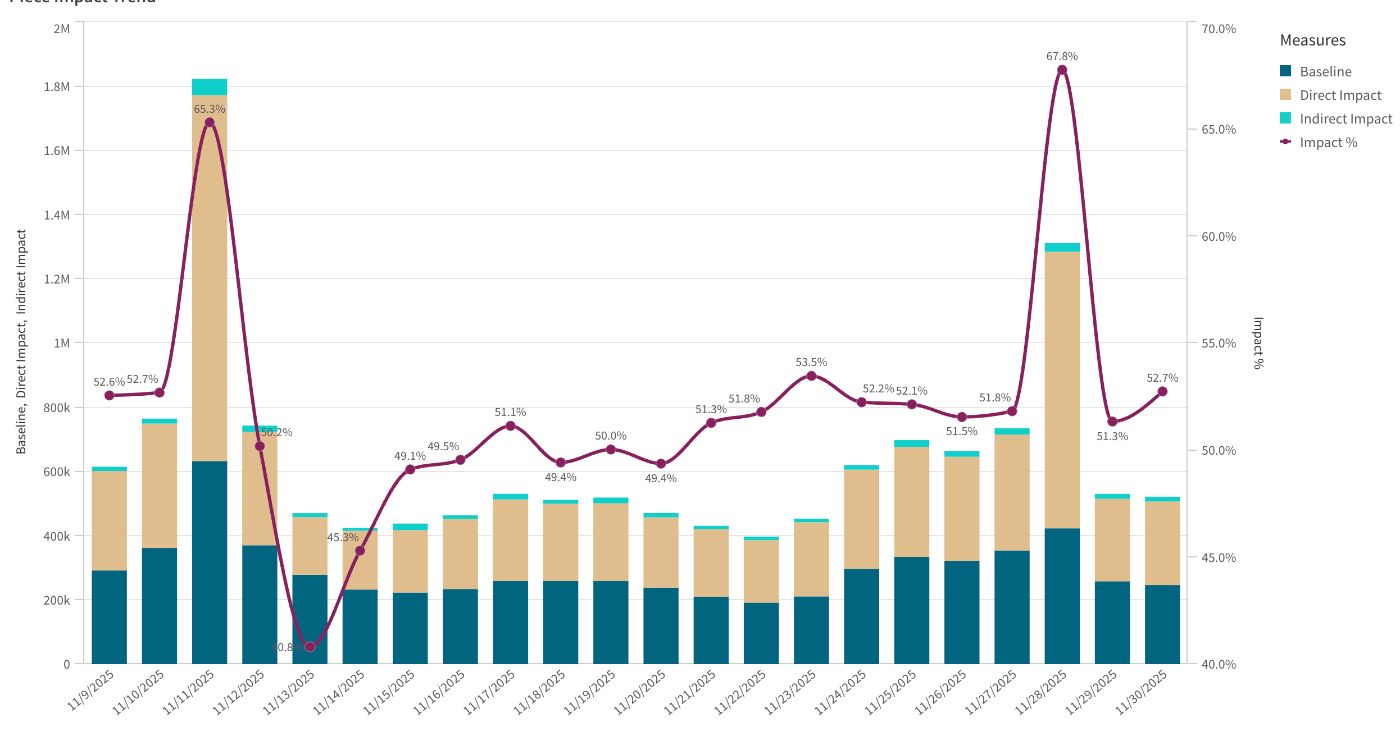
\ When applied to production data, this framework helped explain why similar-looking uplift spikes (particularly around major event days like 11.11 and 28.11) could emerge from very different underlying dynamics. Some spikes aligned closely with direct, mechanically driven effects, while others reflected a more balanced contribution from indirect demand. This distinction allowed teams to move beyond aggregate uplift and reason about how impact was generated, not just how much.
\ \


추천 콘텐츠

Iran proposes reopening Strait of Hormuz to US, excludes nuclear terms

Supreme Court signals it may deal Trump major setback in mass deportation crusade


