

Ethereum Price Prediction: ETH Falls 1% As Tom Lee Predicts Rally To $9K Then $20K In 2026
The Ethereum price edged down by over 1% in the past 24 hours to trade at $2,927 as of 01:30 a.m. EST, with trading volume dropping 6% to $14.8 billion.
This comes as Fundstrat’s Tom Lee says that the price of Ethereum is set for a rally, predicting that the price of ETH could surge to between $7,000-$9,000 in early 2026, as it soars to the $20,000 level in the long-term.
These predictions come amid discussions of a potential supercycle in the crypto space, though Lee cautions against overusing the term.
“I don’t want to overuse the word supercycle,” Lee said.
Meanwhile, the price is still down 2% in the last week.
This drop has also trickled down to the spot Ethereum exchange-traded funds (ETFs). After recording massive inflows on Monday, spot ETH ETFs have since recorded three consecutive outflows as Ethereum drops.
Can the prediction by Tom Lee play out, or is Ethereum poised for a continued drop?
Ethereum Price Faces Indecision Within A Consolidation Zone
The ETH price bulls are in a period of indecision after the asset formed a rounded top pattern, having touched an all-time high of around $4,940 in August.
After touching its ATH, the Ethereum price then went through a correction, completing the rounded top to fall to the $2,700 support area.
This support area has since acted strongly to keep the price of ETH trading within a sideways pattern, capped by the $3,300 resistance from late November.
ETH remains under bearish pressure after forming a death cross around $3,555 and still trades below both the 50-day and 200-day Simple Moving Averages (SMAs).
Moreover, the Relative Strength Index (RSI) is currently moving above the 40 equilibrium levels, currently at 43, and seems to be climbing, which is an indication that the price of ETH is still in a neutral zone.
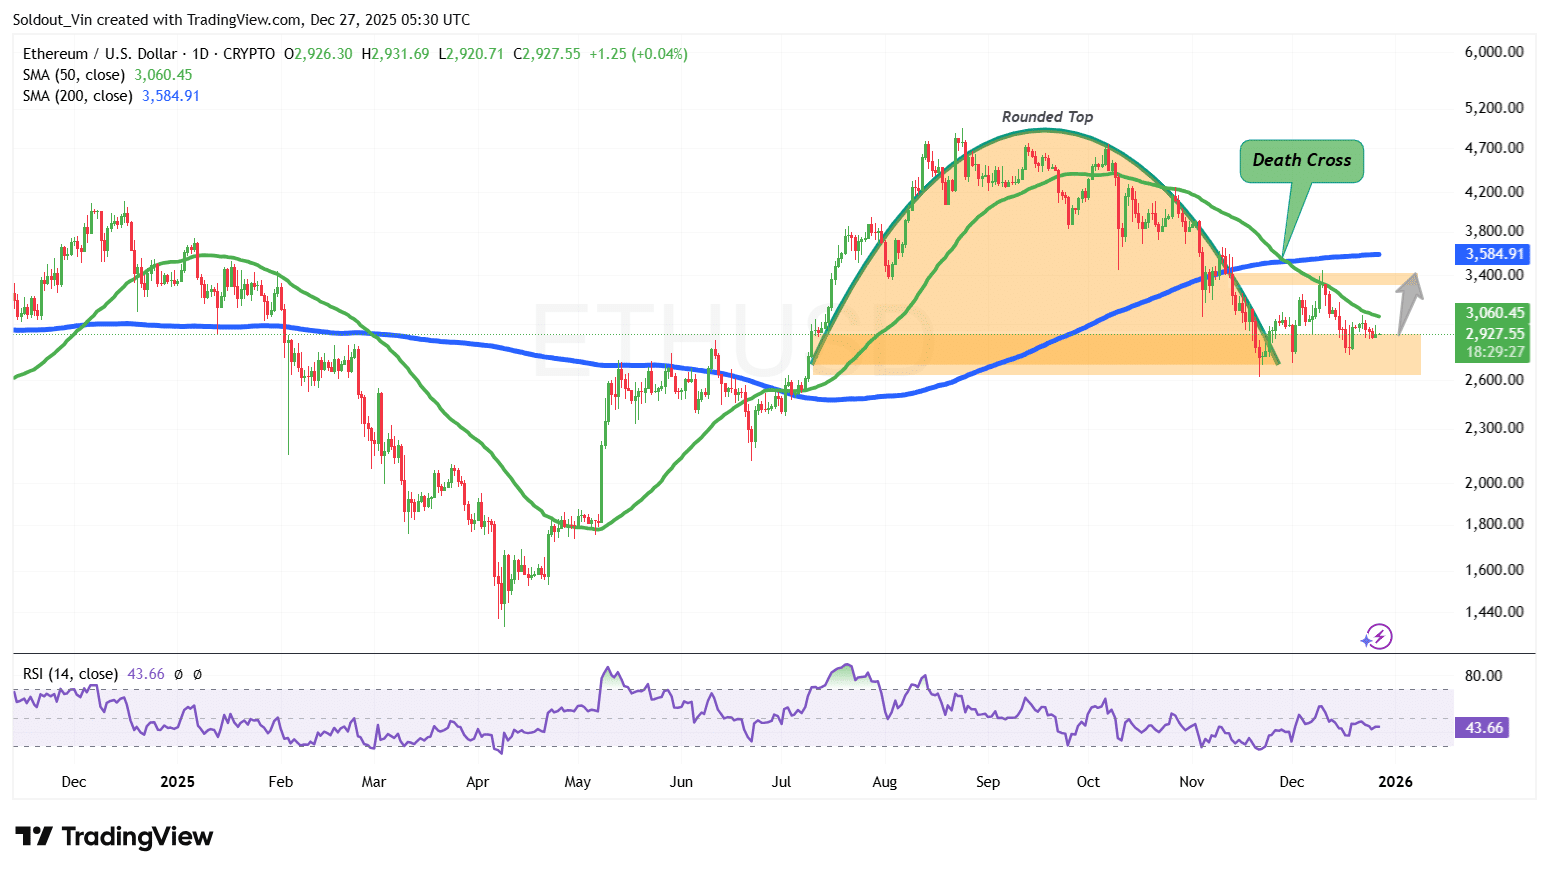 ETH/USD Chart Analysis Source: TradingView
According to the ETH/USD chart analysis on the daily timeframe, the ETH price is currently trading within a sideways pattern in consolidation.
If the bulls use the current area as a zone of demand, Ethereum could surge to the $3,400 resistance area, with a long-term target of around $3,584 within the 200-day SMA.
However, if the bears continue exerting pressure and close below the $2,700 support, the next possible cushion against downward pressure is at the $2,200 mid-year support area.
Crypto analyst Ali Martinez, with over 164k followers on X, says that the price of ETH could drop further to the $1,700 zone, which could be a good buying position.
Related News:


추천 콘텐츠

Trump unhappy with latest peace proposal, says Iran ‘figuring out its leadership’

Australian Dollar underperforms as revived Mideast risks drag risker assets


