BNB Faces Critical Test: Analysts Eye $750 Target Amid Rising Channel
BNB/USDT is currently moving inside a clearly defined rising channel on the daily chart. After a sharp sell-off from recent highs, the token formed a sequence of higher lows and higher highs, respecting both the lower and upper boundaries of the channel. This pattern points to a controlled bullish retracement rather than a continuation of a strong uptrend.
Price is approaching a large supply level at $930-$960. The level corresponds to previous swings’ highs, making it a likely point where the sellers re-enter the market. Traders have indicated that the route the market will follow could represent a fake breakout above the resistance level, before reverting to the original course.
A failure to maintain the position above the level could result in the first target at $848, then the second level at $788, which represent previous demand regions.
BNB Undergoes Short-Term Correction Amid Uptrend
In the weekly chart, BNB/USD is still moving in an uptrend but is correcting since it did not sustain at new highs at $1,226. The current value is around $841, which is moving back from the upper Bollinger Band towards the 20-week simple moving average around $968. This indicates a loss of bullish momentum, but it is still above the Bollinger Band at $710.
This can be supported by looking at the momentum indicators. The RSI (14) is currently at 46, which means there is not as much buying power, but it is not even close to reaching oversold levels. At around the same time, it can be noted that MACD is below its signal line with a negative histogram. This indicates that there is accumulating bearish momentum.
Holding Support Could Sustain Longer-Term Bullish Trend
The volume indicators, such as Bull Power and Bear Power, have entered the negative region, with increased selling and profit-taking at or near the levels where the cycle high was made.
The key levels to support current prices are between $780 and $710, where the areas containing old demand levels intersect with the support provided by the lower Bollinger Band. A close below this region may pave the way for further correction to earlier levels.
Also Read: BNB Fermi Hard Fork 2026: Turbocharging to New Heights


추천 콘텐츠
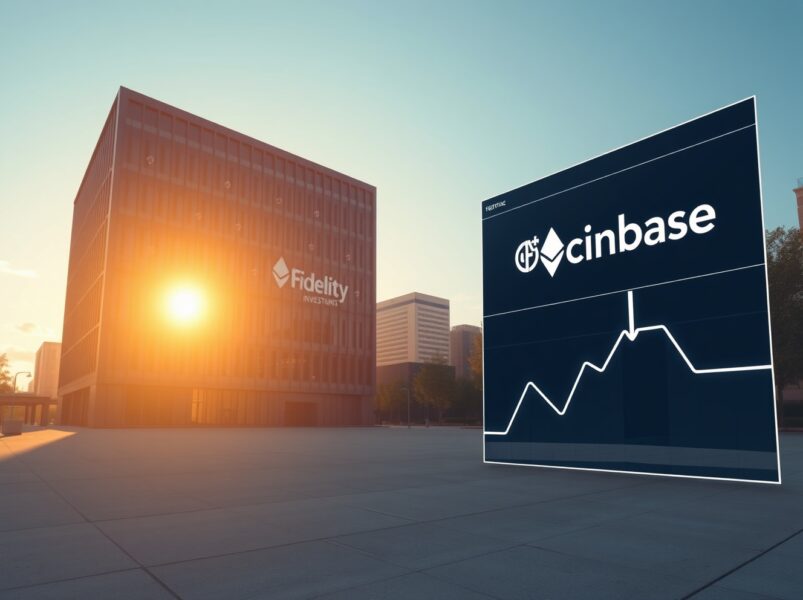
Fidelity ETH Deposit: $45.3M Transfer to Coinbase Sparks Institutional Confidence

Postquant Launches Quantum-Resistant Bitcoin Wallet Without Protocol Changes