

Flow (FLOW) Price Prediction 2025–2029: Can FLOW Recover Above $0.20?
- FLOW plunges toward lower Bollinger Band as bearish momentum accelerates
- Oversold RSI signals exhaustion but confirms strong selling pressure
- Long-term outlook points to gradual recovery if key supports hold
Flow (FLOW) is currently under intense bearish pressure after breaking decisively below critical support levels. The token is trading near $0.111, marking one of its weakest price zones in recent months. A sharp sell-off has pushed FLOW to the lower edge of its volatility range, raising questions about whether the current move represents capitulation or the start of a deeper downtrend.
Market sentiment remains fragile as sellers dominate short-term price action. However, extreme technical conditions suggest that downside momentum may be nearing exhaustion, setting the stage for either a stabilization phase or a high-volatility rebound attempt.
Alaso Read: Pudgy Penguins (PENGU) Price Prediction 2025–2029: Can PENGU Reclaim $0.02 Soon?
Current Market Overview
At the time of analysis, FLOW is trading around $0.111 USDT, posting a steep daily decline following a breakdown from consolidation. Price has decisively moved below the 20-day simple moving average and is now hugging the lower Bollinger Band, indicating strong bearish momentum.
Despite the aggressive sell-off, the lack of immediate continuation lower suggests that buyers may begin defending this zone. Still, until FLOW reclaims key moving averages, the broader structure remains bearish, and any recovery attempts could face heavy resistance overhead.
Technical Analysis
Bollinger Bands
The Bollinger Bands on the daily chart show significant downside expansion, confirming increased volatility driven by sellers. The upper band sits near $0.232, the middle band (20-day SMA) is around $0.178, while the lower band has dropped toward $0.124.
Price has broken well below the middle band and is now trading beneath the lower band, a condition often associated with panic selling or capitulation phases. While such moves can precede short-term bounces, they do not automatically signal trend reversals.
A sustained recovery above $0.124 would be the first sign of stabilization. However, FLOW must reclaim the $0.178 mid-band to invalidate the broader bearish structure. Failure to do so keeps downside risks elevated.
The wide band separation highlights heightened volatility, suggesting that sharp moves—either corrective or continuation-based—remain likely.
RSI Behavior
The Relative Strength Index (RSI 14) is currently hovering around 24, placing FLOW firmly in oversold territory. This reading reflects extreme selling pressure and limited bullish participation.
While an RSI below 30 often signals the potential for a technical rebound, it also confirms strong bearish dominance. Oversold conditions can persist for extended periods during downtrends, meaning traders should watch for RSI stabilization or bullish divergence rather than relying on oversold readings alone.
A move back above 30–35 would be an early signal that selling pressure is easing.
Support and Resistance Levels
Immediate support lies near $0.100, a psychologically important level that could attract dip buyers. A breakdown below this zone would expose FLOW to deeper downside toward $0.085–$0.090.
On the upside, initial resistance is located at $0.124, followed by stronger resistance near $0.178, which aligns with the 20-day moving average. The most significant resistance remains at $0.232, where previous rejection occurred. Only a sustained move above $0.178 would shift the market structure back toward neutral.
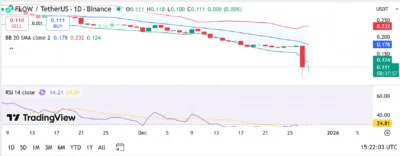
Source: Tradingview
Flow (FLOW) Price Predictions (2025–2029)
| Year | Minimum Price | Average Price | Maximum Price |
| 2025 | $0.095 | $0.145 | $0.210 |
| 2026 | $0.140 | $0.200 | $0.280 |
| 2027 | $0.190 | $0.280 | $0.380 |
| 2028 | $0.260 | $0.360 | $0.480 |
| 2029 | $0.350 | $0.480 | $0.620 |
2025
In 2025, Flow is expected to remain in a recovery and base-building phase following its sharp decline. Price action may remain volatile, with a projected range between $0.095 and $0.210. Reclaiming the $0.178 level would be critical for restoring market confidence and signaling trend stabilization.
2026
By 2026, FLOW could benefit from improving market conditions and renewed interest in Layer-1 blockchain ecosystems. With increased network activity and broader crypto adoption, the average price could rise toward $0.200, with upside potential reaching $0.280 if bullish momentum strengthens.
2027
In 2027, sustained ecosystem growth and long-term holder accumulation could support a more defined uptrend. FLOW may trade within an average range of $0.280, with potential highs near $0.380, reflecting a healthier market structure with higher highs and higher lows.
2028
As the crypto market matures further, Flow could experience greater stability and reduced speculative volatility. Prices are expected to range between $0.260 and $0.480, supported by long-term adoption and improved utility across decentralized applications.
2029
Looking ahead to 2029, FLOW could establish itself as a more mature digital asset within the Layer-1 space. With favorable market cycles and continued development, the token could average around $0.480, with upside potential extending to $0.620, representing significant long-term growth from current levels.
Conclusion
Flow is currently navigating a high-risk, high-volatility phase, marked by oversold technical conditions and strong bearish momentum. While downside pressure remains dominant, extreme RSI readings suggest that selling exhaustion may be approaching.
Holding above the $0.100 support zone will be crucial for preventing further losses. Over the long term, if Flow continues ecosystem development and broader market conditions improve, the token retains the potential for a gradual recovery and renewed upside momentum through 2029.
FAQs
1.What is the current market sentiment for Flow (FLOW)?
Market sentiment is bearish, with price trading below key moving averages and RSI in oversold territory. Volatility remains elevated.
2. Is FLOW currently oversold?
Yes. The RSI is near 24, indicating oversold conditions and potential for a short-term technical bounce.
3. Can FLOW recover above $0.20?
FLOW could reclaim $0.20 if it breaks and holds above the $0.178 resistance level with strong volume support.
4. What are the key levels to watch right now?
Support at $0.100 is critical, while resistance lies at $0.124, $0.178, and $0.232.
5. What is the long-term outlook for FLOW?
- If adoption grows and market sentiment improves, FLOW could gradually trend higher, with long-term projections placing it between $0.48 and $0.62 by 2029.
Also Read: XRP Price Prediction 2025–2029: Can XRP Break Above $2.00 Soon?
The post Flow (FLOW) Price Prediction 2025–2029: Can FLOW Recover Above $0.20? appeared first on 36Crypto.


추천 콘텐츠

Gold price in India: Rates on April 13

Strategy signals another bitcoin buy as company needs just 2% annual BTC growth to cover dividends


